SunTrust 2004 Annual Report Download - page 44
Download and view the complete annual report
Please find page 44 of the 2004 SunTrust annual report below. You can navigate through the pages in the report by either clicking on the pages listed below, or by using the keyword search tool below to find specific information within the annual report.-
 1
1 -
2
-
3
-
4
-
5
-
6
-
7
-
8
-
9
-
10
-
11
-
12
-
13
-
14
-
15
-
16
-
17
-
18
-
19
-
20
-
21
-
22
-
23
-
24
-
25
-
26
-
27
-
28
-
29
-
30
-
31
-
32
-
33
-
 34
34 -
 35
35 -
 36
36 -
 37
37 -
 38
38 -
 39
39 -
 40
40 -
 41
41 -
 42
42 -
 43
43 -
 44
44 -
 45
45 -
 46
46 -
 47
47 -
 48
48 -
 49
49 -
 50
50 -
 51
51 -
 52
52 -
 53
53 -
 54
54 -
55
-
56
-
57
-
58
-
59
-
60
-
61
-
62
-
63
-
64
-
65
-
66
-
67
-
68
-
69
-
70
-
71
-
72
-
73
-
74
-
75
-
76
-
77
-
78
-
79
-
80
-
81
-
82
-
83
-
84
-
85
-
86
-
87
-
88
-
89
-
90
-
91
-
92
-
93
-
94
-
95
-
96
-
97
-
98
-
99
-
100
-
101
-
102
-
103
-
104
-
105
-
106
-
107
-
108
-
109
-
110
-
111
-
112
-
113
-
114
-
115
-
116
 |
 |

42 SUNTRUST 2004 ANNUAL REPORT
MANAGEMENT’S DISCUSSION continued
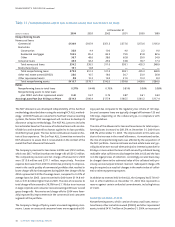
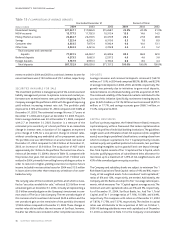
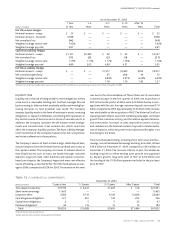
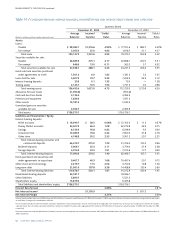
Derivative hedging instrument activities are as follows:
Notional Values1
(Dollars in millions) Asset Hedges Liability Hedges Total
Balance, January 1, 2003 $ 81 $ 4,870 $ 4,951
Additions — 7,464 7,464
Maturities (56) (2,860) (2,916)
Balance, December 31, 2003 25 9,474 9,499
Additions 3,870 7,226 11,096
Terminations — (2,000) (2,000)
Dedesignations — (117) (117)
Maturities (25) (1,101) (1,126)
Balance, December 31, 2004 $3,870 $13,482 $17,352
1Excludes hedges of mortgage lending activities.At December 31, 2004 and 2003, mortgage notional amounts totaled $5.0 billion and $3.9 billion, respectively.
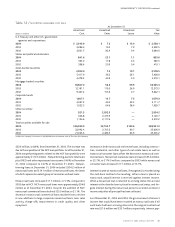
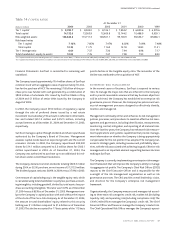
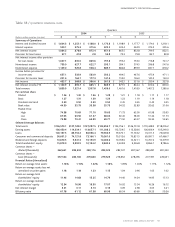
The following table presents the expected maturities of risk management derivative financial instruments:
As of December 31, 2004
1 Year 1–2 2–5 5–10 After 10
(Dollars in millions) or Less Years Years Years Years Total
Cash Flow Asset Hedges
Notional amount – swaps $ — $ 300 $3,500 $ — $ — $3,800
Net unrealized loss — (2) (17) — — (19)
Weighted average receive rate1— 3.17% 3.34% — — 3.33%
Weighted average pay rate1— 2.28 2.28 — — 2.28
Fair Value Asset Hedges
Notional amount – swaps $ 48 $ — $ — $ 22 $ — $ 70
Notional amount – forwards 5,024 — — — — 5,024
Net unrealized gain 11 — — 1 — 12
Weighted average receive rate12.50% — — 3.14% — 2.70%
Weighted average pay rate12.95 — — 4.25 — 3.35
Cash Flow Liability Hedges
Notional amount – swaps $ — $3,350 $2,665 $ — $ — $6,015
Net unrealized gain (loss) — 31 (1) — — 30
Weighted average receive rate1— 2.32% 2.26% — — 2.29%
Weighted average pay rate1— 2.19 4.02 — — 2.91
Fair Value Liability Hedges
Notional amount – swaps $ — $ 450 $ 867 $4,650 $1,500 $7,467
Net unrealized gain (loss) — 28 (5) (92) 30 (39)
Weighted average receive rate1— 7.18% 3.63% 3.92% 4.97% 4.29%
Weighted average pay rate1— 2.09 2.20 2.12 2.15 2.13
1All interest rate swaps have variable pay or receive rates with resets of three months or less, and are the pay or receive rates in effect at December 31, 2004.