SunTrust 2004 Annual Report Download - page 73
Download and view the complete annual report
Please find page 73 of the 2004 SunTrust annual report below. You can navigate through the pages in the report by either clicking on the pages listed below, or by using the keyword search tool below to find specific information within the annual report.-
 1
1 -
2
-
3
-
4
-
5
-
6
-
7
-
8
-
9
-
10
-
11
-
12
-
13
-
14
-
15
-
16
-
17
-
18
-
19
-
20
-
21
-
22
-
23
-
24
-
25
-
26
-
27
-
28
-
29
-
30
-
31
-
32
-
33
-
34
-
35
-
36
-
37
-
38
-
39
-
40
-
41
-
42
-
43
-
44
-
45
-
46
-
47
-
48
-
49
-
50
-
51
-
52
-
53
-
54
-
55
-
56
-
57
-
58
-
59
-
60
-
61
-
62
-
 63
63 -
 64
64 -
 65
65 -
 66
66 -
 67
67 -
 68
68 -
 69
69 -
 70
70 -
 71
71 -
 72
72 -
 73
73 -
 74
74 -
 75
75 -
 76
76 -
 77
77 -
 78
78 -
 79
79 -
 80
80 -
 81
81 -
 82
82 -
 83
83 -
84
-
85
-
86
-
87
-
88
-
89
-
90
-
91
-
92
-
93
-
94
-
95
-
96
-
97
-
98
-
99
-
100
-
101
-
102
-
103
-
104
-
105
-
106
-
107
-
108
-
109
-
110
-
111
-
112
-
113
-
114
-
115
-
116
 |
 |

SUNTRUST 2004 ANNUAL REPORT 71
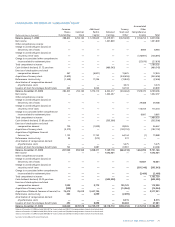
CONSOLIDATED STATEMENTS OF SHAREHOLDERS’EQUITY
Accumulated
Common Additional Treasury Other
Shares Common Paid in Retained Stock and Comprehensive
(Dollars and shares in thousands) Outstanding Stock Capital Earnings Other1Income Total
Balance, January 1, 2002 288,602 $294,163 $ 1,259,609 $ 5,479,951 $ (329,408) $ 1,655,253 $ 8,359,568
Net income — — — 1,331,809 — — 1,331,809
Other comprehensive income:
Change in unrealized gains (losses) on
derivatives, net of taxes — — — — — 8,984 8,984
Change in unrealized gains (losses) on
securities, net of taxes — — — — — (126,891) (126,891)
Change in accumulated other comprehensive
income related to retirement plans — — — — — (27,876) (27,876)
Total comprehensive income — — — — — — 1,186,026
Cash dividends declared, $1.72 per share — — — (489,543) — — (489,543)
Exercise of stock options and stock
compensation element 367 — (6,801) — 19,625 — 12,824
Acquisition of treasury stock (5,659) — — — (340,656) — (340,656)
Performance stock activity (1,448) — 17,236 — (19,842) — (2,606)
Amortization of compensation element
of performance stock — — — — 3,074 — 3,074
Issuance of stock for employee benefit plans 643 — 6,066 — 34,743 — 40,809
Balance, December 31, 2002 282,505 294,163 1,276,110 6,322,217 (632,464) 1,509,470 8,769,496
Net income — — — 1,332,297 — — 1,332,297
Other comprehensive income:
Change in unrealized gains (losses) on
derivatives, net of taxes — — — — — 29,488 29,488
Change in unrealized gains (losses) on
securities, net of taxes — — — — — 115,254 115,254
Change in accumulated other comprehensive
income related to retirement plans — — — — — 9,881 9,881
Total comprehensive income — — — — — — 1,486,920
Cash dividends declared, $1.80 per share — — — (505,396) — — (505,396)
Exercise of stock options and stock
compensation element 700 — (1,859) — 38,526 — 36,667
Acquisition of treasury stock (3,275) — — — (182,152) — (182,152)
Acquisition of Lighthouse Financial
Services, Inc. 1,152 — 11,745 — 64,144 (1) 75,888
Performance stock activity 99 — (572) — 572 — —
Amortization of compensation element
of performance stock — — — — 5,475 — 5,475
Issuance of stock for employee benefit plans 742 — 2,887 — 41,381 — 44,268
Balance, December 31, 2003 281,923 294,163 1,288,311 7,149,118 (664,518) 1,664,092 9,731,166
Net income — — — 1,572,901 — — 1,572,901
Other comprehensive income:
Change in unrealized gains (losses) on
derivatives, net of taxes — — — — — 10,661 10,661
Change in unrealized gains (losses) on
securities, net of taxes — — — — — (395,343) (395,343)
Change in accumulated other comprehensive
income related to retirement plans — — — — — (2,460) (2,460)
Total comprehensive income — — — — — — 1,185,759
Cash dividends declared, $2.00 per share — — — (603,309) — — (603,309)
Exercise of stock options and stock
compensation element 1,905 — 8,775 — 105,125 — 113,900
Acquisition of treasury stock (200) — — — (14,064) — (14,064)
Acquisition of National Commerce Financial, Inc. 76,415 76,415 5,441,136 — — — 5,517,551
Performance stock activity 302 — 2,099 — (2,099) — —
Amortization of compensation element
of performance stock — — — — 8,515 — 8,515
Issuance of stock for employee benefit plans 495 — 8,898 — 38,483 — 47,381
Balance, December 31, 2004 360,840 $370,578 $6,749,219 $8,118,710 $(528,558) $1,276,950 $15,986,899
1Balance at December 31, 2004 included $492,047 for treasury stock and $36,511 for compensation element of restricted stock.
Balance at December 31, 2003 included $634,878 for treasury stock and $29,640 for compensation element of restricted stock.
Balance at December 31, 2002 included $603,602 for treasury stock and $28,862 for compensation element of restricted stock.
See notes to Consolidated Financial Statements.