SunTrust 2004 Annual Report Download - page 63
Download and view the complete annual report
Please find page 63 of the 2004 SunTrust annual report below. You can navigate through the pages in the report by either clicking on the pages listed below, or by using the keyword search tool below to find specific information within the annual report.-
 1
1 -
2
-
3
-
4
-
5
-
6
-
7
-
8
-
9
-
10
-
11
-
12
-
13
-
14
-
15
-
16
-
17
-
18
-
19
-
20
-
21
-
22
-
23
-
24
-
25
-
26
-
27
-
28
-
29
-
30
-
31
-
32
-
33
-
34
-
35
-
36
-
37
-
38
-
39
-
40
-
41
-
42
-
43
-
44
-
45
-
46
-
47
-
48
-
49
-
50
-
51
-
52
-
 53
53 -
 54
54 -
 55
55 -
 56
56 -
 57
57 -
 58
58 -
 59
59 -
 60
60 -
 61
61 -
 62
62 -
 63
63 -
 64
64 -
 65
65 -
 66
66 -
 67
67 -
 68
68 -
 69
69 -
 70
70 -
 71
71 -
 72
72 -
 73
73 -
74
-
75
-
76
-
77
-
78
-
79
-
80
-
81
-
82
-
83
-
84
-
85
-
86
-
87
-
88
-
89
-
90
-
91
-
92
-
93
-
94
-
95
-
96
-
97
-
98
-
99
-
100
-
101
-
102
-
103
-
104
-
105
-
106
-
107
-
108
-
109
-
110
-
111
-
112
-
113
-
114
-
115
-
116
 |
 |

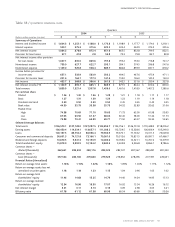
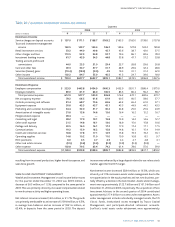
MANAGEMENT’S DISCUSSION continued
SUNTRUST 2004 ANNUAL REPORT 61
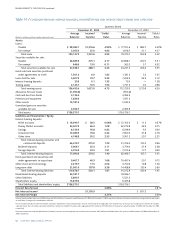
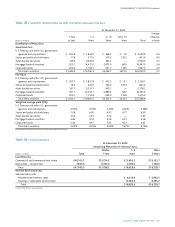
Table 28 / MATURITY DISTRIBUTION OF DEBT SECURITIES AVAILABLE FOR SALE
At December 31, 2004
Average
1 Year 1–5 5–10 After 10 Maturity
(Dollars in millions) or Less Years Years Years Total in Years
Distribution of Maturities:
Amortized Cost
U.S.Treasury and other U.S. government
agencies and corporations $ 225.8 $ 1,842.0 $ 468.2 $ 7.9 $ 2,543.9 3.6
States and political subdivisions 77.8 317.0 314.6 132.2 841.6 6.0
Asset-backed securities1166.2 2,020.6 403.2 — 2,590.0 3.2
Mortgage-backed securities1953.1 14,472.0 2,873.0 68.9 18,367.0 3.6
Corporate bonds 202.0 1,108.7 237.7 118.6 1,667.0 4.4
Total debt securities $1,624.9 $19,760.3 $4,296.7 $327.6 $26,009.5 3.7
Fair Value
U.S.Treasury and other U.S. government
agencies and corporations $ 225.7 $ 1,831.8 $ 472.5 $ 8.1 $ 2,538.1
States and political subdivisions 78.5 322.9 324.9 139.3 865.6
Asset-backed securities1167.1 2,010.7 400.7 — 2,578.5
Mortgage-backed securities1961.1 14,412.7 2,883.3 68.2 18,325.3
Corporate bonds 203.7 1,114.8 244.0 116.8 1,679.3
Total debt securities $1,636.1 $19,692.9 $4,325.4 $332.4 $25,986.8
Weighted average yield (FTE):
U.S.Treasury and other U.S. government
agencies and corporations 2.67% 3.33% 4.42% 6.02% 3.48%
States and political subdivisions 7.08 6.00 6.45 6.77 6.39
Asset-backed securities14.02 3.61 3.72 — 3.65
Mortgage-backed securities13.84 4.12 4.56 6.01 4.18
Corporate bonds 5.06 4.41 5.45 4.23 4.62
Total debt securities 4.00% 4.04% 4.66% 5.67% 4.16%
1Distribution of maturities is based on the expected average life of the asset.
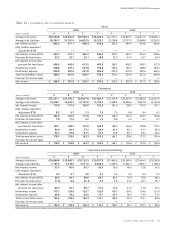
Table 29 / LOAN MATURITY
At December 31, 2004
Remaining Maturities of Selected Loans
Within 1–5 After
(Dollars in millions) Total 1 Year Years 5 Years
Loan Maturity
Commercial and commercial real estate1$40,100.1 $13,274.2 $13,693.2 $13,132.7
Real estate – construction 7,845.4 3,764.0 2,935.4 1,146.0
Total $47,945.5 $17,038.2 $16,628.6 $14,278.7
Interest Rate Sensitivity
Selected loans with:
Predetermined interest rates $ 4,159.6 $ 5,983.5
Floating or adjustable interest rates 12,469.0 8,295.2
Total $16,628.6 $14,278.7
1Excludes $3.8 billion in lease financing.