SunTrust 2004 Annual Report Download - page 18
Download and view the complete annual report
Please find page 18 of the 2004 SunTrust annual report below. You can navigate through the pages in the report by either clicking on the pages listed below, or by using the keyword search tool below to find specific information within the annual report.-
 1
1 -
2
-
3
-
4
-
5
-
6
-
7
-
 8
8 -
 9
9 -
 10
10 -
 11
11 -
 12
12 -
 13
13 -
 14
14 -
 15
15 -
 16
16 -
 17
17 -
 18
18 -
 19
19 -
 20
20 -
 21
21 -
 22
22 -
 23
23 -
 24
24 -
 25
25 -
 26
26 -
 27
27 -
 28
28 -
29
-
30
-
31
-
32
-
33
-
34
-
35
-
36
-
37
-
38
-
39
-
40
-
41
-
42
-
43
-
44
-
45
-
46
-
47
-
48
-
49
-
50
-
51
-
52
-
53
-
54
-
55
-
56
-
57
-
58
-
59
-
60
-
61
-
62
-
63
-
64
-
65
-
66
-
67
-
68
-
69
-
70
-
71
-
72
-
73
-
74
-
75
-
76
-
77
-
78
-
79
-
80
-
81
-
82
-
83
-
84
-
85
-
86
-
87
-
88
-
89
-
90
-
91
-
92
-
93
-
94
-
95
-
96
-
97
-
98
-
99
-
100
-
101
-
102
-
103
-
104
-
105
-
106
-
107
-
108
-
109
-
110
-
111
-
112
-
113
-
114
-
115
-
116
 |
 |

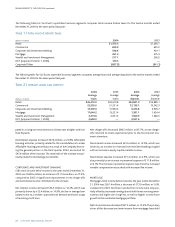
Financial Highlights
Year Ended December 31
(Dollars in millions except per share data) 2004 2003 2002
For the Year
Net income $ 1,572.9 $ 1,332.3 $ 1,331.8
Total revenue16,348.0 5,668.3 5,552.1
Common dividends paid 603.3 505.4 489.5
Per Common Share
Net income – diluted $ 5.19 $ 4.73 $ 4.66
Dividends declared 2.00 1.80 1.72
Common stock closing price 73.88 71.50 56.92
Book value 44.30 34.52 31.04
Financial Ratios
Return on average total assets 1.18% 1.09% 1.23%
Return on average assets less
net unrealized securities gains21.19 1.01 1.10
Return on average total shareholders’ equity 13.71 14.67 15.26
Return on average realized shareholders’ equity215.65 15.98 16.67
Net interest margin33.15 3.08 3.41
Efficiency ratio361.39 59.99 57.99
Tier 1 capital ratio 7.16 7.85 7.47
Total capital ratio 10.36 11.75 11.62
Selected Average Balances
Total assets $133,754.3 $122,325.4 $108,516.1
Earning assets 118,905.6 109,257.4 96,370.8
Loans 86,214.5 76,137.9 71,270.4
Deposits 87,132.9 80,039.0 71,157.2
Total shareholders’ equity 11,469.5 9,083.0 8,725.7
Common shares – diluted (thousands) 303,309 281,434 286,052
At December 31
Total assets $158,869.8 $125,250.5 $117,322.5
Earning assets 138,726.6 112,376.9 104,759.6
Loans 101,426.2 80,732.3 73,167.9
Allowance for loan losses 1,050.0 941.9 930.1
Deposits 103,361.3 81,189.5 79,706.6
Total shareholders’ equity 15,986.9 9,731.2 8,769.5
Common shares outstanding (thousands) 360,840 281,923 282,505
Market value of investment in common stock
of The Coca-Cola Company (48,266,496 shares) 2,004 2,450 2,111
1Total revenue is comprised of net interest income (taxable-equivalent) and noninterest income.
2In this re p o rt, S u n Trust presents a return on ave ra ge assets less net unre a l i zed securities gains and return on ave ra ge re a l i zed equity wh i c h exclude re a l i zed and unre a l i ze d
se c u rities ga i n s /losses and dividends from The Co c a - Cola Co m p a ny. The fo re goi ng nu m b e rs pri m a ri l y reflect adjustments to re m o v e the effects of the ownership by the
Co m p a n y of 48.3 million shares of The Co c a - Cola Co m p a ny.The Co m p a n y uses this information internally to ga u ge its actual performance in the industry. The Co m p a ny believe s
that the return on average assets less the net unrealized securities gains is more indicative of the Company’s return on assets because it more accurately reflects the return
on assets that are related to the Co m p a n y ’ s core businesses.The Co m p a ny also believes that the return on ave ra ge re a l i zed equity is more indicative of the Co m p a n y ’s return on
equity because the excluded equity relates primarily to a long-term holding of a specific security.The Company provides reconcilements on pages 58 through 59 for all non-
GAAP measures.
3The net interest margin and efficiency ratios are presented on a fully taxable-equivalent (FTE) basis. The FTE basis adjusts for the tax-favored status of income from certain
loans and investments.The Co m p a ny believes this measure to be the pre f e r r ed industry measurement of net interest income and provides re l a t i ve compari son between taxable
and non-taxable amounts.
16 S U N T R U S T 2 0 0 4 A N N U A L R E P O R T