SunTrust 2004 Annual Report Download - page 109
Download and view the complete annual report
Please find page 109 of the 2004 SunTrust annual report below. You can navigate through the pages in the report by either clicking on the pages listed below, or by using the keyword search tool below to find specific information within the annual report.-
 1
1 -
2
-
3
-
4
-
5
-
6
-
7
-
8
-
9
-
10
-
11
-
12
-
13
-
14
-
15
-
16
-
17
-
18
-
19
-
20
-
21
-
22
-
23
-
24
-
25
-
26
-
27
-
28
-
29
-
30
-
31
-
32
-
33
-
34
-
35
-
36
-
37
-
38
-
39
-
40
-
41
-
42
-
43
-
44
-
45
-
46
-
47
-
48
-
49
-
50
-
51
-
52
-
53
-
54
-
55
-
56
-
57
-
58
-
59
-
60
-
61
-
62
-
63
-
64
-
65
-
66
-
67
-
68
-
69
-
70
-
71
-
72
-
73
-
74
-
75
-
76
-
77
-
78
-
79
-
80
-
81
-
82
-
83
-
84
-
85
-
86
-
87
-
88
-
89
-
90
-
91
-
92
-
93
-
94
-
95
-
96
-
97
-
98
-
 99
99 -
 100
100 -
 101
101 -
 102
102 -
 103
103 -
 104
104 -
 105
105 -
 106
106 -
 107
107 -
 108
108 -
 109
109 -
 110
110 -
 111
111 -
 112
112 -
 113
113 -
 114
114 -
 115
115 -
 116
116
 |
 |

NOTES TO CONSOLIDATED FINANCIAL STATEMENTS continued
SUNTRUST 2004 ANNUAL REPORT 107
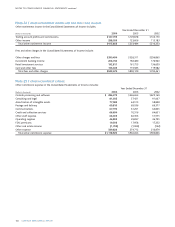
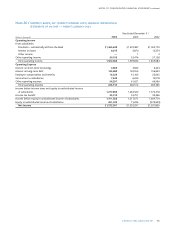
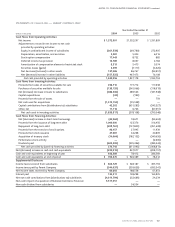
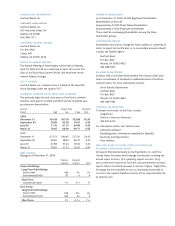
STATEMENTS OF CASH FLOW — PARENT COMPANY ONLY
Year Ended December 31
(Dollars in thousands) 2004 2003 2002
Cash Flows from Operating Activities:
Net income $ 1,572,901 $1,332,297 $ 1,331,809
Adjustments to reconcile net income to net cash
provided by operating activities:
Equity in undistributed income of subsidiaries (261,533) (69,780) 272,905
Depreciation, amortization, and accretion 5,381 5,304 6,016
Stock option compensation 17,443 8,722 885
Deferred income tax provision 14,789 8,037 2,184
Amortization of compensation element of restricted stock 8,515 5,475 3,074
Securities losses (gains) 2,599 (7,117) (4,326)
Net decrease (increase) in other assets 137,486 86,767 (94,951)
Net (decrease) increase in other liabilities (157,525) 467,473 76,108
Net cash provided by operating activities 1,340,056 1,837,178 1,593,704
Cash Flows from Investing Activities:
Proceeds from sales of securities available for sale 256,710 177,712 117,638
Purchases of securities available for sale (138,155) (345,066) (118,919)
Net (increase) decrease in loans to subsidiaries (486,506) 489,526 (181,948)
Capital expenditures (32) (193) —
Proceeds from the sale of assets —— 759
Net cash used for acquisitions (1,519,152) (55,528) —
Capital contributions from (distributions to) subsidiaries 42,202 (651,285) (543,227)
Other, net 11,116 6,726 (67,351)
Net cash used in investing activities (1,833,817) (378,108) (793,048)
Cash Flows from Financing Activities:
Net (decrease) increase in short-term borrowings (46,962) 18,671 (93,604)
Proceeds from the issuance of long-term debt 1,000,000 123,376 316,456
Repayment of long-term debt (208,761) (137,805) (451,608)
Proceeds from the exercise of stock options 96,457 27,945 11,939
Proceeds from stock issuance 47,381 44,268 40,809
Acquisition of treasury stock (14,064) (182,152) (340,656)
Performance stock activity —— (2,606)
Dividends paid (603,309) (505,396) (489,543)
Net cash provided by (used in) financing activities 270,742 (611,093) (1,008,813)
Net (decrease) increase in cash and cash equivalents (223,019) 847,977 (208,157)
Cash and cash equivalents at beginning of year 926,389 78,412 286,569
Cash and cash equivalents at end of period $ 703,370 $ 926,389 $ 78,412
Supplemental Disclosure
Income taxes received from subsidiaries $ 604,729 $ 528,187 $ 495,194
Income taxes paid by Parent Company (544,037) (339,629) (433,341)
Net income taxes received by Parent Company 60,692 188,558 61,853
Interest paid 136,311 138,298 163,805
Net non-cash contributions from (distributions to) subsidiaries (4,319,794) (32,689) 24,234
Non-cash impact of acquisition of National Commerce Financial 5,517,551 ——
Non-cash dividend from subsidiaries —54,554 —