SunTrust 2004 Annual Report Download - page 36
Download and view the complete annual report
Please find page 36 of the 2004 SunTrust annual report below. You can navigate through the pages in the report by either clicking on the pages listed below, or by using the keyword search tool below to find specific information within the annual report.-
 1
1 -
2
-
3
-
4
-
5
-
6
-
7
-
8
-
9
-
10
-
11
-
12
-
13
-
14
-
15
-
16
-
17
-
18
-
19
-
20
-
21
-
22
-
23
-
24
-
25
-
 26
26 -
 27
27 -
 28
28 -
 29
29 -
 30
30 -
 31
31 -
 32
32 -
 33
33 -
 34
34 -
 35
35 -
 36
36 -
 37
37 -
 38
38 -
 39
39 -
 40
40 -
 41
41 -
 42
42 -
 43
43 -
 44
44 -
 45
45 -
 46
46 -
47
-
48
-
49
-
50
-
51
-
52
-
53
-
54
-
55
-
56
-
57
-
58
-
59
-
60
-
61
-
62
-
63
-
64
-
65
-
66
-
67
-
68
-
69
-
70
-
71
-
72
-
73
-
74
-
75
-
76
-
77
-
78
-
79
-
80
-
81
-
82
-
83
-
84
-
85
-
86
-
87
-
88
-
89
-
90
-
91
-
92
-
93
-
94
-
95
-
96
-
97
-
98
-
99
-
100
-
101
-
102
-
103
-
104
-
105
-
106
-
107
-
108
-
109
-
110
-
111
-
112
-
113
-
114
-
115
-
116
 |
 |

34 SUNTRUST 2004 ANNUAL REPORT
MANAGEMENT’S DISCUSSION continued
The NCF allowance was developed independently of the SunTrust
methodology described above using the existing NCF ALLL method-
ology. Until NCF loans are converted to SunTrust’s loan accounting
systems, the former NCF management will continue to develop its
allowance using its methodology. The NCF ALLL process includes
loss estimates based on the review of individual loans with an iden-
tifiable loss and estimated loss factors applied to its loan portfolio,
stratified by loan grade. The loss factor estimates are based on his-
torical loss experience. The SunTrust ALLL Committee reviews the
NCF allowance to assure that it is reasonable in the context of the
overall SunTrust allowance framework.
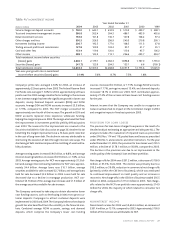
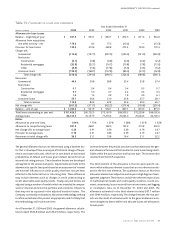
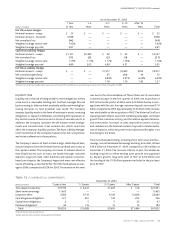
The Company’s provision for loan losses in 2004 was $135.5 million,
which was $65.7 million less than net charge-offs of $201.2 million.
The comparable provision and net charge-off amounts for 2003
were $313.6 million and $311.1 million, respectively. Provision
expense decreased from 2003 to 2004 due primarily to improve-
ment in the credit quality of commercial portfolios that resulted in
lower charge-offs for that segment during 2004. Net charge-offs for
2004 represented 0.23% of average loans, compared to 0.41% of
average loans for 2003. Loan recoveries for 2004 were $114.8 mil-
lion, or $31.6 million higher than in 2003. The ratio of recoveries to
total charge-offs increased to 36.3% from 21.1% due to an increase
in large corporate and consumer recoveries along with lower overall
gross charge-offs. Recoveries and charge-offs for 2004 were favor-
ably impacted by improvements in the commercial and consumer
segments of the portfolio.
The Company’s charge-off policy meets or exceeds regulatory mini-
mums. Losses on unsecured consumer loans are recognized at 90-
days past due compared to the regulatory loss criteria of 120 days.
Secured consumer loans are typically charged off between 120 and
180 days, depending on the collateral type, in compliance with
FFIEC guidelines.
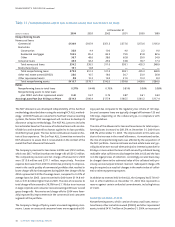
The ratio of the allowance for loan and lease losses to total nonper-
forming loans increased to 281.3% at December 31, 2004 from
268.1% at December 31, 2003. The improvement in this ratio was
due to the increase in the overall allowance. As mentioned earlier,
the mix of nonperforming loans was affected by the acquisition of
the NCF portfolio. Commercial loans and real estate loans are typi-
cally placed on non-accrual when principal or interest is past due for
90 days or more unless the loan is both secured by collateral having
realizable value sufficient to discharge the debt in full and the loan
is in the legal process of collection. Accordingly, secured loans may
be charged-down to the estimated value of the collateral with pre-
viously accrued unpaid interest reversed. Subsequent charge-offs
may be required as a result of changes in the market value of collat-
eral or other repayment prospects.
In addition to reserves held in the ALLL, the Company had $7.8 mil-
lion in other liabilities at December 31, 2004 that represents a
reserve against certain unfunded commitments, including letters
of credit.
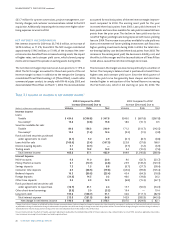
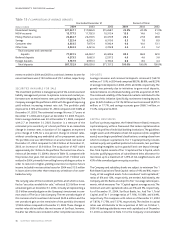
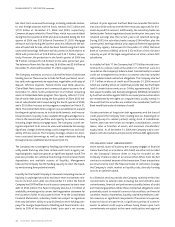
NONPERFORMING ASSETS
Nonperforming assets, which consist of nonaccrual loans, restruc-
tured loans, other real estate owned (OREO), and other repossessed
assets, totaled $410.7 million at December 31, 2004, an increase of
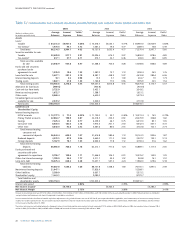
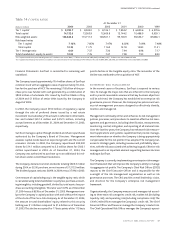
Table 11 / NONPERFORMING ASSETS AND ACCRUING LOANS PAST DUE 90 DAYS OR MORE
At December 31
(Dollars in millions) 2004 2003 2002 2001 2000 1999
Nonperforming Assets
Nonaccrual loans
Commercial $130.9 $165.9 $351.3 $377.6 $273.6 $105.0
Real estate
Construction 32.8 4.4 10.0 4.0 2.2 9.0
Residential mortgages 104.5 85.4 82.5 79.9 81.8 82.6
Other 36.7 48.6 38.0 62.8 29.0 34.9
Consumer loans 49.3 32.2 29.2 33.8 18.7 17.4
Total nonaccrual loans 354.2 336.5 511.0 558.1 405.3 248.9
Restructured loans 19.1 14.8 — — — —
Total nonperforming loans 373.3 351.3 511.0 558.1 405.3 248.9
Other real estate owned (OREO) 28.6 16.5 18.0 20.7 23.0 26.8
Other repossessed assets 8.8 10.3 13.0 21.0 10.3 8.3
Total nonperforming assets $410.7 $378.1 $542.0 $599.8 $438.6 $284.0
Ratios
Nonperforming loans to total loans 0.37% 0.44% 0.70% 0.81% 0.56% 0.38%
Nonperforming assets to total loans
plus OREO and other repossessed assets 0.40 0.47 0.74 0.87 0.61 0.43
Accruing Loans Past Due 90 Days or More $214.3 $196.4 $177.9 $185.5 $181.2 $117.4