SunTrust 2004 Annual Report Download - page 108
Download and view the complete annual report
Please find page 108 of the 2004 SunTrust annual report below. You can navigate through the pages in the report by either clicking on the pages listed below, or by using the keyword search tool below to find specific information within the annual report.-
 1
1 -
2
-
3
-
4
-
5
-
6
-
7
-
8
-
9
-
10
-
11
-
12
-
13
-
14
-
15
-
16
-
17
-
18
-
19
-
20
-
21
-
22
-
23
-
24
-
25
-
26
-
27
-
28
-
29
-
30
-
31
-
32
-
33
-
34
-
35
-
36
-
37
-
38
-
39
-
40
-
41
-
42
-
43
-
44
-
45
-
46
-
47
-
48
-
49
-
50
-
51
-
52
-
53
-
54
-
55
-
56
-
57
-
58
-
59
-
60
-
61
-
62
-
63
-
64
-
65
-
66
-
67
-
68
-
69
-
70
-
71
-
72
-
73
-
74
-
75
-
76
-
77
-
78
-
79
-
80
-
81
-
82
-
83
-
84
-
85
-
86
-
87
-
88
-
89
-
90
-
91
-
92
-
93
-
94
-
95
-
96
-
97
-
 98
98 -
 99
99 -
 100
100 -
 101
101 -
 102
102 -
 103
103 -
 104
104 -
 105
105 -
 106
106 -
 107
107 -
 108
108 -
 109
109 -
 110
110 -
 111
111 -
 112
112 -
 113
113 -
 114
114 -
 115
115 -
 116
116
 |
 |

106 SUNTRUST 2004 ANNUAL REPORT
NOTES TO CONSOLIDATED FINANCIAL STATEMENTS continued
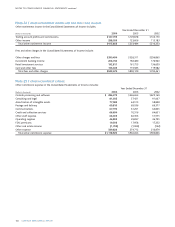
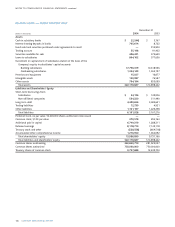
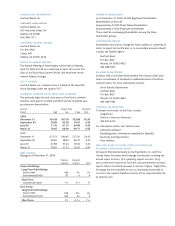
BALANCE SHEETS — PARENT COMPANY ONLY
December 31
(Dollars in thousands) 2004 2003
Assets
Cash in subsidiary banks $ (2,244) $ 3,767
Interest-bearing deposits in banks 705,614 8,722
Funds sold and securities purchased under agreements to resell —913,900
Trading account 55,198 91,432
Securities available for sale 486,421 572,639
Loans to subsidiaries 864,162 377,656
Investment in capital stock of subsidiaries stated on the basis of the
Company’s equity in subsidiaries’ capital accounts
Banking subsidiaries 17,796,319 10,618,566
Nonbanking subsidiaries 1,334,149 1,365,197
Premises and equipment 15,027 16,877
Intangible assets 129,987 76,587
Other assets 794,194 853,099
Total assets $22,178,827 $14,898,442
Liabilities and Shareholders’ Equity
Short-term borrowings from
Subsidiaries $ 54,126 $ 139,006
Non-affiliated companies 534,220 311,490
Long-term debt 4,489,656 3,485,621
Trading liabilities 12,739 4,921
Other liabilities 1,101,187 1,226,238
Total liabilities 6,191,928 5,167,276
Preferred stock, no par value; 50,000,000 shares authorized; none issued ——
Common stock, $1.00 par value 370,578 294,163
Additional paid in capital 6,749,219 1,288,311
Retained earnings 8,118,710 7,149,118
Treasury stock and other (528,558) (664,518)
Accumulated other comprehensive income 1,276,950 1,664,092
Total shareholders’ equity 15,986,899 9,731,166
Total liabilities and shareholders’ equity $22,178,827 $14,898,442
Common shares outstanding 360,840,710 281,923,057
Common shares authorized 750,000,000 750,000,000
Treasury shares of common stock 9,737,688 12,239,700