SunTrust 2004 Annual Report Download - page 61
Download and view the complete annual report
Please find page 61 of the 2004 SunTrust annual report below. You can navigate through the pages in the report by either clicking on the pages listed below, or by using the keyword search tool below to find specific information within the annual report.-
 1
1 -
2
-
3
-
4
-
5
-
6
-
7
-
8
-
9
-
10
-
11
-
12
-
13
-
14
-
15
-
16
-
17
-
18
-
19
-
20
-
21
-
22
-
23
-
24
-
25
-
26
-
27
-
28
-
29
-
30
-
31
-
32
-
33
-
34
-
35
-
36
-
37
-
38
-
39
-
40
-
41
-
42
-
43
-
44
-
45
-
46
-
47
-
48
-
49
-
50
-
 51
51 -
 52
52 -
 53
53 -
 54
54 -
 55
55 -
 56
56 -
 57
57 -
 58
58 -
 59
59 -
 60
60 -
 61
61 -
 62
62 -
 63
63 -
 64
64 -
 65
65 -
 66
66 -
 67
67 -
 68
68 -
 69
69 -
 70
70 -
 71
71 -
72
-
73
-
74
-
75
-
76
-
77
-
78
-
79
-
80
-
81
-
82
-
83
-
84
-
85
-
86
-
87
-
88
-
89
-
90
-
91
-
92
-
93
-
94
-
95
-
96
-
97
-
98
-
99
-
100
-
101
-
102
-
103
-
104
-
105
-
106
-
107
-
108
-
109
-
110
-
111
-
112
-
113
-
114
-
115
-
116
 |
 |

MANAGEMENT’S DISCUSSION continued
SUNTRUST 2004 ANNUAL REPORT 59
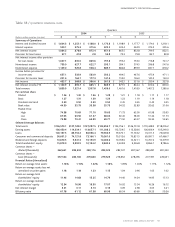
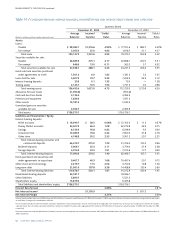
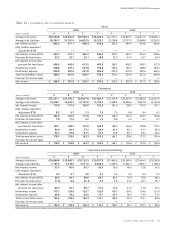
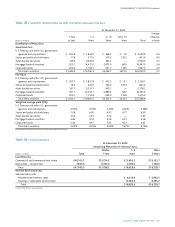
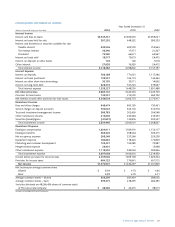
Table 24 / RECONCILEMENT OF NON-GAAP MEASURES – QUARTERLY
2004 2003
(Dollars in millions except per share data) 4321 4321
Net income $ 455.7 $ 368.8 $ 386.6 $ 361.8 $ 342.5 $ 331.6 $ 330.4 $ 327.8
Securities losses/(gains), net of tax 12.6 11.8 5.9 (3.2) (12.7) (20.2) (20.3) (27.3)
Net income excluding securities
gains and losses 468.3 380.6 392.5 358.6 329.8 311.4 310.1 300.5
The Coca-Cola Company dividend,
net of tax (10.7) (10.7) (10.7) (10.7) (9.5) (9.5) (9.5) (9.5)
Net income excluding securities
gains and losses and The
Coca-Cola Company dividend $ 457.6 $ 369.9 $ 381.8 $ 347.9 $ 320.3 $ 301.9 $ 300.6 $ 291.0
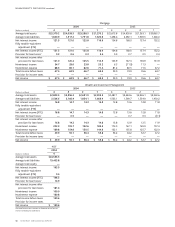
Net income $ 455.7 — — — ————
Merger expense, net of tax 18.5 — — — ————
Operating net income $ 474.2 — — — ————
Noninterest expense $ 1,149.0 — — — ————
Merger expense (28.4) — — — ————
$ 1,120.6 — — — ————
Diluted earnings per share $ 1.26 — — — ————
Impact of excluding merger expense 0.05 — — — ————
Operating diluted earnings
per share $ 1.31 — — — ————
Efficiency ratio 61.78% — — — ————
Impact of excluding merger expense (1.53) — — — ————
Operating efficiency ratio 60.25% — — — ————
Total average assets $156,570.1 $127,128.0 $127,287.5 $123,853.7 $124,756.1 $126,701.8 $119,448.0 $118,276.2
Average net unrealized securities
gains (2,056.7) (2,055.0) (2,803.9) (2,580.3) (2,363.9) (2,401.9) (2,293.3) (2,311.6)
Average assets less net unrealized
securities gains $154,513.4 $125,073.0 $124,483.6 $121,273.4 $122,392.2 $124,299.9 $117,154.7 $115,964.6
Total average equity $ 15,819.0 $ 9,992.9 $ 10,194.2 $ 9,840.3 $ 9,435.8 $ 9,236.8 $ 8,864.1 $ 8,786.6
Average accumulated other
comprehensive income (1,304.6) (1,318.3) (1,804.8) (1,645.7) (1,503.4) (1,526.4) (1,450.4) (1,463.5)
Total average realized equity $ 14,514.4 $ 8,674.6 $ 8,389.4 $ 8,194.6 $ 7,932.4 $ 7,710.4 $ 7,413.7 $ 7,323.1
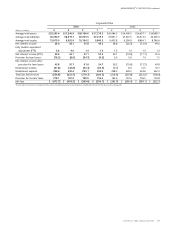
Return on average total assets 1.16% 1.15% 1.22% 1.18% 1.09% 1.04% 1.11% 1.12%
Impact of excluding net realized
and unrealized securities gains/
losses and The Coca-Cola
Company dividend 0.02 0.03 0.01 (0.03) (0.05) (0.08) (0.08) (0.10)
Return on average assets less net
unrealized securities gains11.18% 1.18% 1.23% 1.15% 1.04% 0.96% 1.03% 1.02%
Return on average total
shareholders’ equity 11.46% 14.68% 15.25% 14.79% 14.40% 14.24% 14.95% 15.13%
Impact of excluding net unrealized
securities gains 1.08 2.28 3.05 2.28 1.62 1.30 1.31 0.99
Return on average realized
shareholders’ equity212.54% 16.96% 18.30% 17.07% 16.02% 15.54% 16.26% 16.12%
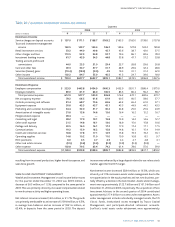
Net interest income $ 1,084.2 $ 876.8 $ 872.4 $ 851.6 $ 865.5 $ 832.8 $ 799.5 $ 822.5
FTE adjustment 16.7 16.9 12.7 12.3 12.0 11.6 10.9 10.5
Net interest income – FTE 1,100.9 893.7 885.1 863.9 877.5 844.4 810.4 833.0
Noninterest income 759.0 627.7 622.7 595.1 584.1 574.5 596.8 547.6
Total revenue 1,859.9 1,521.4 1,507.8 1,459.0 1,461.6 1,418.9 1,407.2 1,380.6
Securities losses/(gains) 19.4 18.2 9.0 (4.9) (19.5) (31.1) (31.2) (42.0)
Total revenue excluding securities
gains and losses $ 1,879.3 $ 1,539.6 $ 1,516.8 $ 1,454.1 $ 1,442.1 $ 1,387.8 $ 1,376.0 $ 1,338.6
1Computed by dividing annualized net income excluding securities gains/losses and The Coca-Cola Company dividend, by average assets less net unrealized securities gains.
2Computed by dividing annualized net income excluding securities gains/losses and The Coca-Cola Company dividend, by average realized shareholders’ equity.