SunTrust 2004 Annual Report Download - page 92
Download and view the complete annual report
Please find page 92 of the 2004 SunTrust annual report below. You can navigate through the pages in the report by either clicking on the pages listed below, or by using the keyword search tool below to find specific information within the annual report.-
 1
1 -
2
-
3
-
4
-
5
-
6
-
7
-
8
-
9
-
10
-
11
-
12
-
13
-
14
-
15
-
16
-
17
-
18
-
19
-
20
-
21
-
22
-
23
-
24
-
25
-
26
-
27
-
28
-
29
-
30
-
31
-
32
-
33
-
34
-
35
-
36
-
37
-
38
-
39
-
40
-
41
-
42
-
43
-
44
-
45
-
46
-
47
-
48
-
49
-
50
-
51
-
52
-
53
-
54
-
55
-
56
-
57
-
58
-
59
-
60
-
61
-
62
-
63
-
64
-
65
-
66
-
67
-
68
-
69
-
70
-
71
-
72
-
73
-
74
-
75
-
76
-
77
-
78
-
79
-
80
-
81
-
 82
82 -
 83
83 -
 84
84 -
 85
85 -
 86
86 -
 87
87 -
 88
88 -
 89
89 -
 90
90 -
 91
91 -
 92
92 -
 93
93 -
 94
94 -
 95
95 -
 96
96 -
 97
97 -
 98
98 -
 99
99 -
 100
100 -
 101
101 -
 102
102 -
103
-
104
-
105
-
106
-
107
-
108
-
109
-
110
-
111
-
112
-
113
-
114
-
115
-
116
 |
 |

90 SUNTRUST 2004 ANNUAL REPORT
NOTES TO CONSOLIDATED FINANCIAL STATEMENTS continued
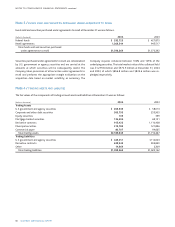
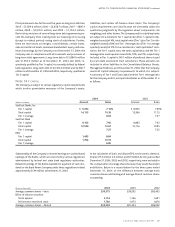
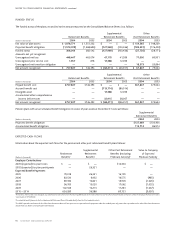
The following table presents information on stock options and performance stock:
Stock Options Performance Stock
Weighted- Weighted-
Average Deferred Average
(Dollars in thousands except per share data) Shares Price Range Exercise Price Shares Compensation Grant Price
Balance, January 1, 2002 12,130,296 $11.13 – $76.50 $ 56.70 2,971,597 $ 37,517 $ —
Granted 478,191 58.21 – 67.98 62.78 19,523 1,261 64.62
Exercised/vested (415,634) 11.13 – 65.25 33.14 (145,913) — —
Cancelled, expired/forfeited (449,945) 11.13 – 73.06 63.96 (157,715) (6,842) —
Amortization of compensation
for performance stock — — — — (3,074) —
Balance, December 31, 2002 11,742,908 13.96 – 76.50 57.56 2,687,492 28,862 —
Granted 3,818,050 54.28 – 69.90 54.48 198,985 11,040 55.48
Exercised/vested (777,087) 6.96 – 65.25 36.14 (22,930) — —
Cancelled, expired/forfeited (795,225) 21.03 – 73.06 61.50 (100,382) (4,787) —
Acquisition of Lighthouse 175,417 6.96 – 22.75 13.32 — — —
Amortization of compensation
for performance stock — — — — (5,475) —
Balance, December 31, 2003 14,164,063 6.96 – 76.50 57.14 2,763,165 29,640 —
Granted 4,013,523 65.33 – 73.19 73.07 271,844 19,062 70.13
Exercised/vested (2,046,298) 6.96 – 73.06 45.89 (148,026) — —
Cancelled, expired/forfeited (529,229) 45.23 – 73.19 64.79 (72,667) (3,676) —
Acquisition of NCF 5,830,146 12.85 – 67.64 46.89 — — —
Amortization of compensation
for performance stock — — — — (8,515) —
Balance, December 31, 2004 21,432,205 $ 6.96 – $76.50 $58.21 2,814,316 $36,511
Exercisable, December 31, 2004 13,767,506 $54.86
Available for additional grant,
December 31, 2004 14,519,102
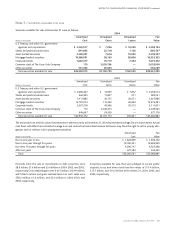
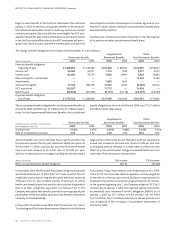
The following table presents information on stock options by ranges of exercise price:
Options Outstanding Options Exercisable
Number Weighted Weighted Number Weighted
Outstanding at Average Average Remain- Exercisable at Average
December 31, Exercise ing Contractual December 31, Exercise
Range of Exercise Prices 2004 Price Life (Years) 2004 Price
$ 6.96 to $49.61 3,573,493 $37.95 4.03 3,573,493 $37.95
49.63 to 64.57 11,150,417 56.25 7.07 7,420,941 56.89
64.73 to 76.50 6,708,295 72.26 7.13 2,773,072 71.20
21,432,205 $58.21 6.60 13,767,506 $54.86