SunTrust 2004 Annual Report Download - page 49
Download and view the complete annual report
Please find page 49 of the 2004 SunTrust annual report below. You can navigate through the pages in the report by either clicking on the pages listed below, or by using the keyword search tool below to find specific information within the annual report.-
 1
1 -
2
-
3
-
4
-
5
-
6
-
7
-
8
-
9
-
10
-
11
-
12
-
13
-
14
-
15
-
16
-
17
-
18
-
19
-
20
-
21
-
22
-
23
-
24
-
25
-
26
-
27
-
28
-
29
-
30
-
31
-
32
-
33
-
34
-
35
-
36
-
37
-
38
-
 39
39 -
 40
40 -
 41
41 -
 42
42 -
 43
43 -
 44
44 -
 45
45 -
 46
46 -
 47
47 -
 48
48 -
 49
49 -
 50
50 -
 51
51 -
 52
52 -
 53
53 -
 54
54 -
 55
55 -
 56
56 -
 57
57 -
 58
58 -
 59
59 -
60
-
61
-
62
-
63
-
64
-
65
-
66
-
67
-
68
-
69
-
70
-
71
-
72
-
73
-
74
-
75
-
76
-
77
-
78
-
79
-
80
-
81
-
82
-
83
-
84
-
85
-
86
-
87
-
88
-
89
-
90
-
91
-
92
-
93
-
94
-
95
-
96
-
97
-
98
-
99
-
100
-
101
-
102
-
103
-
104
-
105
-
106
-
107
-
108
-
109
-
110
-
111
-
112
-
113
-
114
-
115
-
116
 |
 |

MANAGEMENT’S DISCUSSION continued
SUNTRUST 2004 ANNUAL REPORT 47
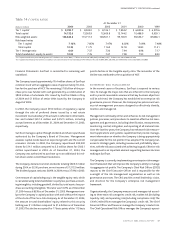
Noninterest income was $2,303.0 million in 2003, compared to
$2,268.8 million in 2002, an increase of $34.2 million, or 1.5%.The
increase was attributed to an improvement in customer-driven fee
income, specifically in the wealth management and capital market
business, and increases in service charges on deposits and other
charges and fees. Retail investment services income increased $25.1
million, or 18.4%, due to an increase in broker production, an
increase in the number of brokers, and increased revenue generated
by Alexander Key.
Combined trading account profits and commissions and investment
banking income, the Company’s capital market revenue sources,
increased $22.2 million, or 7.9%, from 2002 to 2003 as a result of
strong growth in the debt capital markets business. Service charges
on deposits increased $30.2 million, or 4.9%, due to increased
NSF/stop payment volumes, increased pricing and other revenue
enhancement initiatives. Other charges and fees also increased
from 2002 to 2003 as a result of increased letter of credit fees and
insurance revenues. Other noninterest income increased $10.4 mil-
lion, or 9.2%, primarily due to the consolidation of certain
Affordable Housing partnerships, due to the Company becoming the
general partner in the third quarter of 2003.
Noninterest expense was $3,400.6 million in 2003, compared to
$3,219.4 million in 2002, an increase of $181.2 million, or 5.6%.
Personnel expenses increased $126.0 million, or 6.9%, primarily due
to increased incentive and pension costs. Commissions and per-
formance-based incentive payments increased as a result of busi-
ness growth, higher production volumes, and higher revenue in the
Wealth and Investment Management, CIB, and Mortgage lines of
business. Marketing and customer development increased $20.3
million, or 25.4%, due to an expanded marketing strategy and sales
focus.Also impacting the increase in noninterest expense was the
consolidation of certain affordable housing partnerships, which
contributed $28.7 million of the increase. In 2002, the Company
incurred $56.2 million of noninterest expense related to the One
Bank initiative, which enhanced customer-based systems in an
effort to improve operating efficiencies.
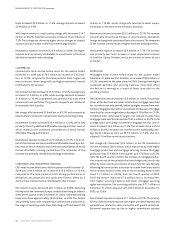
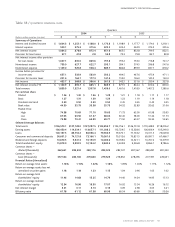
Average earning assets increased $12.9 billion, or 13.4%, from 2002
to 2003, of which $1.3 billion was related to the consolidation of
Three Pillars. Average loans increased $4.9 billion, or 6.8%, from
2002 to 2003.The consolidation of Three Pillars contributed $1.1
billion of the increase.Also contributing to the increase was a signif-
icant rise in residential mortgage loans partially due to the im-
provement in adjustable rate mortgage production in 2003.Average
loans held for sale increased $4.2 billion, or 94.7%, from 2002 to
2003 due to an increase in refinancing activity resulting from the
low rate environment.
Average interest-bearing liabilities increased $9.6 billion, or 12.1%,
from 2002 to 2003. Average consumer and commercial deposits
increased $4.0 billion, or 6.1%, compared to 2002, primarily due to
increases in demand deposits, Money Market, and NOW accounts.
Demand deposits increased $2.6 billion, or 16.8%, and NOW
accounts increased $1.4 billion, or 13.4%, as the Company bene-
fited from initiatives to grow customer deposits and overall volatil-
ity in the financial markets.
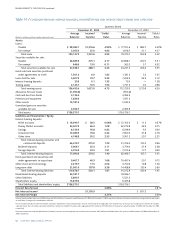
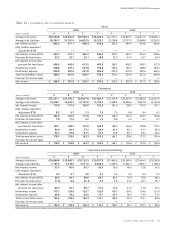
BUSINESS SEGMENTS
The following analysis details the operating results for each line of
business for the years ended December 31, 2003 and 2002.These
periods have been restated to conform to the 2004 presentation.
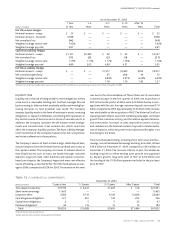
RETAIL
Retail’s total income before taxes for the year ended December 31,
2003 was $1,260.7 million, an increase of $106.6 million, or 9.2%,
compared to 2002. Net interest income increased $87.1 million, or
5.2%. Net charge-offs increased $5.8 million, or 3.5%. The net
charge-offs increase was due to increased net charge-offs in the
indirect lending category.
Noninterest income increased $30.4 million, or 4.2%, which was
driven primarily by growth in service charges on deposit accounts.
Noninterest expense increased $5.1 million, or 0.5%.
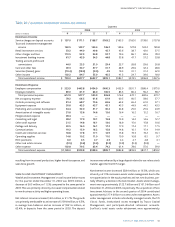
COMMERCIAL
Commercial’s total income before taxes for the year ended
December 31, 2003 was $635.2 million, an increase of $147.7 mil-
lion, or 30.3%, compared to 2002. Improvement in net interest
income driven by balance sheet growth and noninterest income
contributed to that increase.
Net interest income increased $90.9 million, or 16.2%. Average
loans increased $2.0 billion, or 10.4%, while average deposits
increased $1.8 billion, or 20.9%.
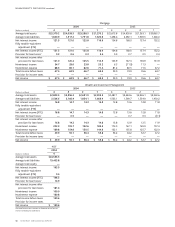
Net charge-offs increased $1.4 million, or 7.5%, from 2002. Net
charge-offs remained at historically low levels and overall credit
quality continued to be strong.
Noninterest income increased $72.6 million, or 33.7%, which was
driven by a $61.7 million increase from Affordable Housing activi-
ties. In the third quarter of 2003, the Company became the general
partner in certain Affordable Housing partnerships, which resulted
in the consolidation of these partnerships. In addition, the Company
continued to earn additional income tax credits from its investment
in these partnerships, which in 2003 began being classified on a
before tax equivalent basis as noninterest income in Commercial.
Commercial’s prior year results were not able to be restated to
reflect the impact of the tax credits.
Noninterest expense increased $14.4 million, or 5.3%. Affordable
Housing activities, primarily related to the consolidation of certain
Affordable Housing partnerships due to the Company becoming
the general partner in the third quarter of 2003, accounted for $7.6
million of the increase.