SunTrust 2004 Annual Report Download - page 41
Download and view the complete annual report
Please find page 41 of the 2004 SunTrust annual report below. You can navigate through the pages in the report by either clicking on the pages listed below, or by using the keyword search tool below to find specific information within the annual report.-
 1
1 -
2
-
3
-
4
-
5
-
6
-
7
-
8
-
9
-
10
-
11
-
12
-
13
-
14
-
15
-
16
-
17
-
18
-
19
-
20
-
21
-
22
-
23
-
24
-
25
-
26
-
27
-
28
-
29
-
30
-
 31
31 -
 32
32 -
 33
33 -
 34
34 -
 35
35 -
 36
36 -
 37
37 -
 38
38 -
 39
39 -
 40
40 -
 41
41 -
 42
42 -
 43
43 -
 44
44 -
 45
45 -
 46
46 -
 47
47 -
 48
48 -
 49
49 -
 50
50 -
 51
51 -
52
-
53
-
54
-
55
-
56
-
57
-
58
-
59
-
60
-
61
-
62
-
63
-
64
-
65
-
66
-
67
-
68
-
69
-
70
-
71
-
72
-
73
-
74
-
75
-
76
-
77
-
78
-
79
-
80
-
81
-
82
-
83
-
84
-
85
-
86
-
87
-
88
-
89
-
90
-
91
-
92
-
93
-
94
-
95
-
96
-
97
-
98
-
99
-
100
-
101
-
102
-
103
-
104
-
105
-
106
-
107
-
108
-
109
-
110
-
111
-
112
-
113
-
114
-
115
-
116
 |
 |

MANAGEMENT’S DISCUSSION continued
SUNTRUST 2004 ANNUAL REPORT 39
interest rate risk.The policies established by ALCO are reviewed and
approved by the Company’s Board of Directors.
MARKET RISK FROM NON-TRADING ACTIVITIES
The primary goal of interest rate risk management is to control
exposure to interest rate risk, both within policy limits approved by
ALCO and the Board, and within narrower guidelines established by
ALCO.These limits and guidelines reflect SunTrust’s tolerance for
interest rate risk over both short-term and long-term horizons.
The major sources of the Company’s non-trading interest rate risk
are timing differences in the maturity and repricing characteristics
of assets and liabilities, changes in relationships between rate
indices (basis risk), changes in the shape of the yield curve, and the
potential exercise of explicit or embedded options. SunTrust meas-
ures these risks and their impact by identifying and quantifying
exposures through use of sophisticated simulation and valuation
models, as well as duration gap analysis.
One of the primary methods that SunTrust uses to quantify and
manage interest rate risk is simulation analysis, which is used to
model net interest income from assets, liabilities, and derivative
positions over a specified time period under various interest rate
scenarios and balance sheet structures.This analysis measures the
sensitivity of net interest income over a relatively short time
horizon (two years). Key assumptions in the simulation analysis
(and in the valuation analysis discussed later in this section) relate
to the behavior of interest rates and spreads, the changes in product
balances and the behavior of loan and deposit customers in differ-
ent rate environments. Material assumptions include the repricing
characteristics and balance fluctuations of indeterminate, or non-
contractual, deposits.
As the future path of interest rates cannot be known in advance,
management uses simulation analysis to project net interest
income under various interest rate scenarios including expected, or
“most likely,” as well as deliberately extreme and perhaps unlikely
scenarios. The analyses may include rapid and gradual ramping
of interest rates, rate shocks, spread narrowing and widening, and
yield curve twists. Usually, each analysis incorporates what man-
agement believes to be the most appropriate assumptions about
customer behavior in an interest rate scenario, but in some analy-
ses, assumptions are deliberately changed to test the Company’s
exposure to a specified event or set of events. Specific strategies are
also analyzed to determine their impact on net interest income
levels and sensitivities.
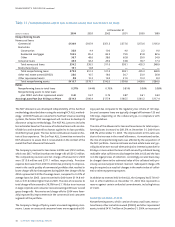
The following table reflects the estimated sensitivity of net interest
income to changes in interest rates.The sensitivity is measured as a
percentage change in net interest income due to gradual changes in
interest rates (25 basis points per quarter) compared to forecasted
net interest income under stable rates for the next twelve months.
Estimated changes set forth above are dependent on material
assumptions such as those previously discussed.
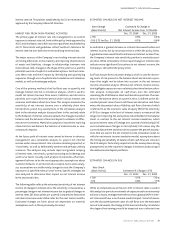
ESTIMATED CHANGES IN NET INTEREST INCOME
Rate Change Estimated % Change in
(Basis Points) Net Interest Income Over 12 Months
Dec. 31, 2004 Dec. 31, 2003
+100 0.3% 0.2%
-100 (-75 for Dec. 31, 2003) -0.1% -0.6%
As indicated, a gradual decrease in interest rates would reduce net
interest income, but by an amount that is within the policy limits.
A gradual increase would tend to enhance net interest income.Thus,
the Company’s interest rate sensitivity position is modestly asset-
sensitive.While simulations of more rapid changes in interest rates
indicate more significant fluctuations in net interest income, the
Company is still within the policy limits.
SunTrust also performs valuation analysis, which is used for discern-
ing levels of risk present in the balance sheet and derivative posi-
tions that might not be taken into account in the net interest
income simulation analysis.Whereas net interest income simula-
tion highlights exposures over a relatively short time horizon, valua-
tion analysis incorporates all cash flows over the estimated
remaining life of all balance sheet and derivative positions.The valu-
ation of the balance sheet, at a point in time, is defined as the dis-
counted present value of asset cash flows and derivative cash flows
minus the discounted value of liability cash flows, the net of which
is referred to as the economic value of equity (EVE).The sensitivity
of EVE to changes in the level of interest rates is a measure of the
longer-term repricing risk and options risk embedded in the balance
sheet. In contrast to the net interest income simulation, which
assumes interest rates will change over a period of time (ramp), EVE
uses instantaneous changes in rates (shock). EVE values only the
current balance sheet and does not incorporate the growth assump-
tions that are used in the net interest income simulation model. As
with the net interest income simulation model, assumptions about
the timing and variability of balance sheet cash flows are critical in
the EVE analysis. Particularly important are the assumptions driving
prepayments and the expected changes in balances and pricing of
the indeterminate deposit portfolios.
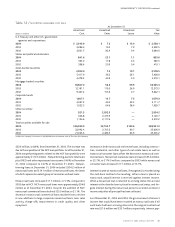
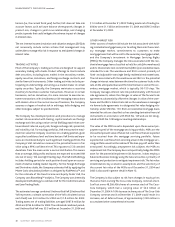
ESTIMATED CHANGES IN EVE
Rate Shock
(Basis Points) Estimated % Change in EVE
Dec. 31, 2004 Dec. 31, 2003
+100 -3.1% -3.3%
-100 0.6% 1.5%
While an instantaneous and severe shift in interest rates is used in
this analysis to provide an estimate of exposure under an extremely
adverse scenario, management believes that a gradual shift in inter-
est rates would have a much more modest impact. Since EVE meas-
ures the discounted present value of cash flows over the estimated
lives of instruments, the change in EVE does not directly correlate to
the degree that earnings would be impacted over a shorter time