SunTrust 2004 Annual Report Download - page 55
Download and view the complete annual report
Please find page 55 of the 2004 SunTrust annual report below. You can navigate through the pages in the report by either clicking on the pages listed below, or by using the keyword search tool below to find specific information within the annual report.-
 1
1 -
2
-
3
-
4
-
5
-
6
-
7
-
8
-
9
-
10
-
11
-
12
-
13
-
14
-
15
-
16
-
17
-
18
-
19
-
20
-
21
-
22
-
23
-
24
-
25
-
26
-
27
-
28
-
29
-
30
-
31
-
32
-
33
-
34
-
35
-
36
-
37
-
38
-
39
-
40
-
41
-
42
-
43
-
44
-
 45
45 -
 46
46 -
 47
47 -
 48
48 -
 49
49 -
 50
50 -
 51
51 -
 52
52 -
 53
53 -
 54
54 -
 55
55 -
 56
56 -
 57
57 -
 58
58 -
 59
59 -
 60
60 -
 61
61 -
 62
62 -
 63
63 -
 64
64 -
 65
65 -
66
-
67
-
68
-
69
-
70
-
71
-
72
-
73
-
74
-
75
-
76
-
77
-
78
-
79
-
80
-
81
-
82
-
83
-
84
-
85
-
86
-
87
-
88
-
89
-
90
-
91
-
92
-
93
-
94
-
95
-
96
-
97
-
98
-
99
-
100
-
101
-
102
-
103
-
104
-
105
-
106
-
107
-
108
-
109
-
110
-
111
-
112
-
113
-
114
-
115
-
116
 |
 |

MANAGEMENT’S DISCUSSION continued
SUNTRUST 2004 ANNUAL REPORT 53
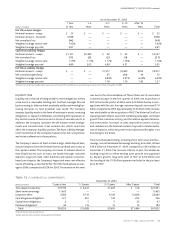
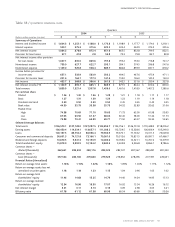
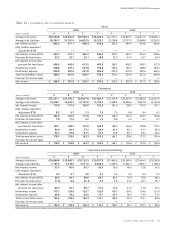
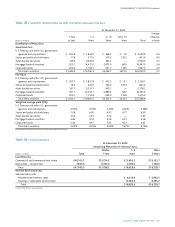
Table 20 / QUARTERLY NONINTEREST INCOME AND EXPENSE
Quarters
2004 2003
(Dollars in millions) 43214321
Noninterest Income
Service charges on deposit accounts $ 197.0 $171.1 $168.7 $163.2 $165.3 $162.0 $158.0 $157.8
Trust and investment management
income 160.5 149.7 140.4 136.2 129.6 127.8 124.2 120.8
Retail investment services 53.2 44.0 49.8 45.7 43.6 38.7 42.0 37.5
Other charges and fees 110.5 92.5 94.8 92.7 79.4 86.1 82.6 78.3
Investment banking income 61.7 45.9 54.3 44.8 53.8 47.7 57.2 33.8
Trading account profits and
commissions 44.0 23.3 31.0 29.4 22.7 26.8 29.6 30.8
Card and other fees 49.3 34.7 37.7 31.7 28.9 29.6 32.4 28.6
Securities (losses) gains (19.4) (18.2) (9.0) 4.9 19.5 31.1 31.2 42.0
Other income 102.2 84.7 55.0 46.5 41.3 24.7 39.6 18.0
Total noninterest income $ 759.0 $627.7 $622.7 $595.1 $584.1 $574.5 $596.8 $547.6
Noninterest Expense
Employee compensation $ 523.9 $445.8 $434.9 $400.3 $432.9 $391.7 $386.4 $375.0
Employee benefits 89.0 81.9 86.0 106.5 83.3 80.4 96.2 98.7
Total personnel expense 612.9 527.7 520.9 506.8 516.2 472.1 482.6 473.7
Net occupancy expense 78.2 66.5 61.6 61.9 60.5 60.5 58.6 57.7
Outside processing and software 81.4 68.7 70.6 65.6 63.2 65.4 61.0 57.1
Equipment expense 50.8 43.3 45.7 45.1 45.5 44.9 44.5 43.5
Marketing and customer development 34.4 32.0 31.7 30.2 24.8 25.0 25.6 24.9
Amortization of intangible assets 31.8 15.6 14.6 15.6 16.4 16.2 15.2 16.7
Merger-related expense 28.4 — — — ————
Consulting and legal 28.2 17.9 19.1 15.8 15.9 14.2 14.6 12.7
Other staff expense 21.5 14.8 16.1 13.6 18.9 15.0 15.8 10.6
Postage and delivery 20.5 16.0 16.1 17.2 17.0 17.4 17.1 17.5
Communications 19.2 15.9 16.2 15.8 14.8 16.1 15.4 14.9
Credit and collection services 18.8 17.8 17.1 12.9 15.8 19.3 19.2 16.1
Operating supplies 14.6 10.2 11.0 11.0 10.9 10.8 8.5 9.7
FDIC premiums 6.0 4.5 4.7 4.3 4.4 4.7 4.8 4.1
Other real estate income (0.5) (0.6) (0.4) (0.3) (0.9) (0.3) (0.8) —
Other expense 102.8 79.5 83.4 74.2 61.4 78.6 55.6 59.0
Total noninterest expense $1,149.0 $929.8 $928.4 $889.7 $884.8 $859.9 $837.7 $818.2
resulting from increased production, higher benefits expense, and
sales force growth.
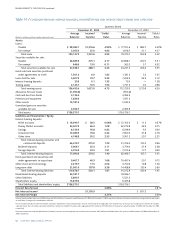
WEALTH AND INVESTMENT MANAGEMENT
Wealth and Investment Management’s total income before taxes
for the quarter ended December 31, 2004 was $49.9 million, a
decrease of $6.3 million, or 11.2%, compared to the same period in
2003.This was primarily driven by increased compensation related
to new business activity and higher operating losses.
Net interest income increased $3.0 million, or 21.7%.The growth
was primarily attributable to an increase of $139.8 million, or 6.5%,
in average loan balances and an increase of $921.6 million, or
62.4%, in deposits from the same period in 2003. The deposit
increase was enhanced by a large deposit related to our role as stock
transfer agent for the NCF merger.
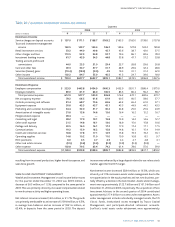
Noninterest income increased $28.4 million, or 16.3%, which was
driven by a 21.5% increase in assets under management due to the
net appreciation in the equity markets and net new business, par-
tially offset by a decline in the bond market. Assets under manage-
ment were approximately $122.7 billion and $101.0 billion as of
December 31, 2004 and 2003, respectively.The acquisition of Seix
Investment Advisors in the second quarter of 2004 contributed
approximately $17.4 billion to assets under management. Assets
under management include individually managed assets, the STI
Classic Funds, institutional assets managed by Trusco Capital
Management, and participant-directed retirement accounts.
SunTrust’s total assets under advisement were approximately