SunTrust 2004 Annual Report Download - page 27
Download and view the complete annual report
Please find page 27 of the 2004 SunTrust annual report below. You can navigate through the pages in the report by either clicking on the pages listed below, or by using the keyword search tool below to find specific information within the annual report.-
 1
1 -
2
-
3
-
4
-
5
-
6
-
7
-
8
-
9
-
10
-
11
-
12
-
13
-
14
-
15
-
16
-
 17
17 -
 18
18 -
 19
19 -
 20
20 -
 21
21 -
 22
22 -
 23
23 -
 24
24 -
 25
25 -
 26
26 -
 27
27 -
 28
28 -
 29
29 -
 30
30 -
 31
31 -
 32
32 -
 33
33 -
 34
34 -
 35
35 -
 36
36 -
 37
37 -
38
-
39
-
40
-
41
-
42
-
43
-
44
-
45
-
46
-
47
-
48
-
49
-
50
-
51
-
52
-
53
-
54
-
55
-
56
-
57
-
58
-
59
-
60
-
61
-
62
-
63
-
64
-
65
-
66
-
67
-
68
-
69
-
70
-
71
-
72
-
73
-
74
-
75
-
76
-
77
-
78
-
79
-
80
-
81
-
82
-
83
-
84
-
85
-
86
-
87
-
88
-
89
-
90
-
91
-
92
-
93
-
94
-
95
-
96
-
97
-
98
-
99
-
100
-
101
-
102
-
103
-
104
-
105
-
106
-
107
-
108
-
109
-
110
-
111
-
112
-
113
-
114
-
115
-
116
 |
 |

MANAGEMENT’S DISCUSSION continued
SUNTRUST 2004 ANNUAL REPORT 25
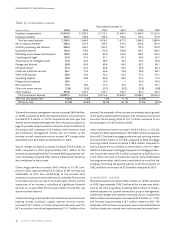
for sale that was only partially offset by higher income from portfo-
lio loans. Mortgage loans held for sale average balance decreased
$3.2 billion, or 40.1%. Combined with net interest margin compres-
sion, this resulted in a $140.7 million, or 42.6%, decline in net inter-
est income.Total average loans, principally residential mortgages,
increased $4.4 billion, or 33.5%.This resulted in an increase in net
interest income of $61.2 million, or 29.5%. Lower average deposit
balances, due to reduced loan prepayments, also produced a decline
in net interest income of $8.0 million.
Net charge-offs increased $1.2 million, or 48.3%, but remained at a
low level. Noninterest income increased $101.7 million. The
increase in noninterest income was driven by lower amortization of
mortgage servicing rights and higher servicing fee income.
Mortgage servicing rights amortization declined $161.7 million, or
49.1%, due to slower loan prepayments. Servicing fees increased
$30.6 million, or 23.2%, principally due to higher servicing balances.
The servicing portfolio was $77.7 billion at December 31, 2004
compared with $69.0 billion at December 31, 2003.The increase in
servicing income was partially offset by lower loan production
income, which declined $96.5 million, or 63.9%.The decline was
driven by lower production volumes and compressed margins.
Mortgage loan production for 2004 was $30.2 billion, a decline of
$13.5 billion, or 30.8%, from 2003.Additionally,Cherokee Insurance
revenue, the captive reinsurance subsidiary, increased $8.4 million,
or 50.5%.
Noninterest expense increased $26.9 million, or 9.0%. Higher per-
sonnel expense and expenditures related to sales promotions and
growth initiatives were the primary drivers.The higher personnel
expense was principally a result of sales force growth and higher
benefit costs.
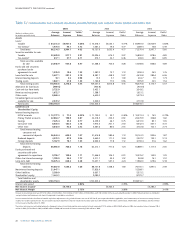
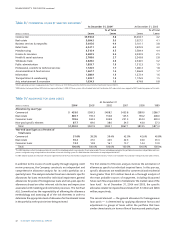
WEALTH AND INVESTMENT MANAGEMENT
Wealth and Investment Management’s total income before taxes
for the year ended December 31, 2004 was $217.1 million, an
increase of $17.0 million, or 8.5%, compared to 2003. Higher bro-
kerage and insurance sales as well as the income generated from
increased assets under management and the Seix acquisition con-
tributed to the increase.
Net interest income increased $8.6 million, or 16.6%.The growth
was due to an increase of $272.4 million, or 13.6%, in average loans
and an increase of $480.4 million, or 32.4%, in average deposits
over the prior year.
Noninterest income increased $111.8 million, or 16.8%. The
increase was driven by growth in trust and investment management
income (due to increased assets under management, estate settle-
ment fees, and distribution fees) as well as higher retail investment
income. In 2004, the Company acquired the majority of the assets
of Seix Investment Advisors, a leading institutional fixed-income
boutique.The Seix acquisition contributed $27.1 million, or 24.2%,
of the increase. Brokerage related income increased $36.7 million
from the same period last year and was driven by higher broker
staffing and productivity levels and increased insurance sales. End-
of-period total assets under advisement were approximately
$212.4 billion, which included $122.7 billion in discretionary bal-
ances, $24.9 billion in non-managed corporate trust assets, $39.3
billion in non-managed trust assets, and $25.5 billion in retail bro-
kerage assets.
Noninterest expense increased $103.8 million, or 20.1%.The Seix
acquisition, increased commissions and incentives from new busi-
ness activity, additional sales personnel, and additional expense
related to the conversion to a new trust accounting system
expected to occur in 2005, all contributed to the increase.
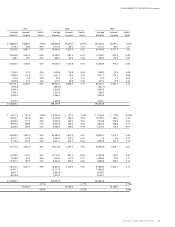
NCF
NCF’s income before taxes for the fourth quarter and year ended
December 31, 2004 was $120.6 million. For the fourth quarter of
2004, average earning assets totaled $21.2 billion and average
deposits and other funding totaled $18.9 billion, resulting in $196.3
million in net interest income. Net interest income also included
$4.3 million of purchase accounting expense, representing amorti-
zation of balance sheet fair value adjustments. Noninterest income
of $100.0 million for the quarter included service charges on
deposit accounts, trust and investment management income,
investment banking income, mortgage income, and other charges
and fees. Noninterest expenses represent personnel costs, occu-
pancy expense, and all other operating expenses. Included in nonin-
terest expense was $15.9 million in purchase accounting
adjustments, primarily related to core deposit intangible amortiza-
tion and $4.7 million for one-time merger expenses.
CORPORATE/OTHER
Corporate/Other’s loss before taxes for the year ended December
31, 2004 was $857.5 million, compared to a loss of $841.3 million
for 2003.
Net interest income increased $133.9 million due to balance sheet
management derivative activities and lower matched-maturity
funds transfer pricing allocated to the lines of business.
The loan loss provision declined $68.1 million due to improved
credit quality and the difference between the Company’s consoli-
dated provision and net charge-offs.
Noninterest income declined $180.1 million in 2004 compared to
2003.The primary reason was due to net securities losses of $42.4
million in 2004 versus net securities gains of $121.7 million in 2003.
The net securities losses in 2004 were due to the Company selling
lower-yielding securities in order to reinvest in higher-yielding secu-
rities to improve future income.
Noninterest expense increased $38.1 million, or 4.2%, compared to
2003.The increase was primarily due to merger-related expenses of