SunTrust 2004 Annual Report Download - page 34
Download and view the complete annual report
Please find page 34 of the 2004 SunTrust annual report below. You can navigate through the pages in the report by either clicking on the pages listed below, or by using the keyword search tool below to find specific information within the annual report.-
 1
1 -
2
-
3
-
4
-
5
-
6
-
7
-
8
-
9
-
10
-
11
-
12
-
13
-
14
-
15
-
16
-
17
-
18
-
19
-
20
-
21
-
22
-
23
-
 24
24 -
 25
25 -
 26
26 -
 27
27 -
 28
28 -
 29
29 -
 30
30 -
 31
31 -
 32
32 -
 33
33 -
 34
34 -
 35
35 -
 36
36 -
 37
37 -
 38
38 -
 39
39 -
 40
40 -
 41
41 -
 42
42 -
 43
43 -
 44
44 -
45
-
46
-
47
-
48
-
49
-
50
-
51
-
52
-
53
-
54
-
55
-
56
-
57
-
58
-
59
-
60
-
61
-
62
-
63
-
64
-
65
-
66
-
67
-
68
-
69
-
70
-
71
-
72
-
73
-
74
-
75
-
76
-
77
-
78
-
79
-
80
-
81
-
82
-
83
-
84
-
85
-
86
-
87
-
88
-
89
-
90
-
91
-
92
-
93
-
94
-
95
-
96
-
97
-
98
-
99
-
100
-
101
-
102
-
103
-
104
-
105
-
106
-
107
-
108
-
109
-
110
-
111
-
112
-
113
-
114
-
115
-
116
 |
 |

32 SUNTRUST 2004 ANNUAL REPORT
MANAGEMENT’S DISCUSSION continued
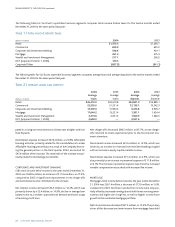
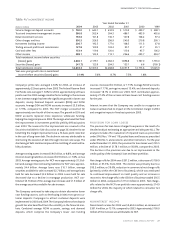
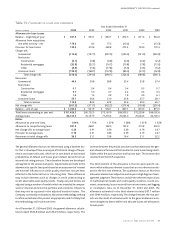
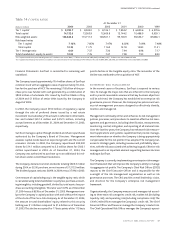
Table 9 / ALLOWANCE FOR LOAN LOSSES
At December 31
(Dollars in millions) 20041200322002 2001 2000 1999
Allocation by Loan Type
Commercial $ 433.0 $369.3 $408.5 $435.8 $389.0 $286.7
Real estate 369.7 159.3 150.8 145.5 190.2 208.0
Consumer loans 159.6 344.3 332.8 251.3 252.3 339.3
Non-pool specific element 87.7 69.0 38.0 34.5 43.0 37.3
Total $1,050.0 $941.9 $930.1 $867.1 $874.5 $871.3
Year-end Loan Types as a Percent of
Total Loans
Commercial 31.6% 38.2% 39.4% 42.0% 42.6% 40.8%
Real estate 55.2 47.0 44.5 42.3 43.0 45.3
Consumer loans 13.2 14.8 16.1 15.7 14.4 13.9
Total 100.0% 100.0% 100.0% 100.0% 100.0% 100.0%
1The 2004 allocations reflect the implementation of a new ALLL methodology which is more granular than in prior periods.The new methodology segregates the portfolio into seventeen sub-portfolios and incor-
porates a weighted average of expected loss derived from an internal risk rating system.The 2004 allocation also includes the acquired portfolio of NCF.
2In 2003 and prior periods, the allocation reflected an apportionment of the ALLL that had been categorized as “environmental factors,” which is now included in the Company’s homogeneous loan pool estimates.
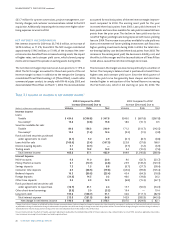
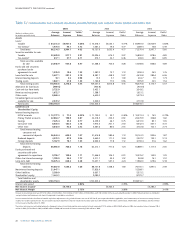
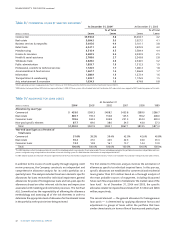
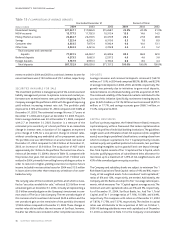
Table 8 / COMMERCIAL LOANS BY SELECTED INDUSTRIES1
At December 31, 20042At December 31, 2003
% of Total % of Total
(Dollars in millions) Loans Loans Loans Loans
Construction $5,930.8 5.8 $3,404.7 4.2
Real estate 5,084.5 5.0 3,327.5 4.1
Business services & nonprofits 5,005.6 4.9 3,101.1 3.8
Retail trade 4,047.1 4.0 3,205.9 4.0
Manufacturing 3,516.4 3.5 3,584.4 4.4
Finance & insurance 3,482.5 3.4 2,030.9 2.5
Health & social assistance 2,768.6 2.7 2,243.8 2.8
Wholesale trade 2,628.0 2.6 2,546.5 3.2
Public administration 1,893.7 1.9 1,512.3 1.9
Professional, scientific & technical services 1,726.9 1.7 1,480.3 1.8
Accommodation & food services 1,467.7 1.4 1,366.8 1.7
Information 1,288.9 1.3 1,272.4 1.6
Transportation & warehousing 1,209.7 1.2 1,176.9 1.5
Arts, entertainment & recreation 1,034.3 1.0 674.8 0.8
1Industry groupings are loans in aggregate greater than $1 billion as of 12/31/04 based on the North American Industry Classification System (NAICS).
22004 includes the loan portfolio of NCF, which was acquired October 1, 2004.NCF loan systems utilize Standard Industrial Classification (SIC) codes, which were mapped to NAICS codes for purposes of this table.
In addition to the review of credit quality through ongoing credit
review processes, the Company constructs an independent and
comprehensive allowance analysis for its credit portfolios on a
quarterly basis. The analysis includes three basic elements: specific
allowances for loans reviewed for individual impairment, general
allowances for pools of homogeneous loans and non-pool-specific
allowances based on other inherent risk factors and imprecision
associated with modeling and estimation processes. The SunTrust
ALLL Committee has the responsibility of affirming the allowance
methodology and assessing all of the risk elements in order to
determine the appropriate level of allowance for the inherent losses
in the portfolio at the point in time being reviewed.
The first element of the ALLL analysis involves the estimation of
allowances specific to individual impaired loans. In this process,
specific allowances are established for commercial and residential
loans greater than $0.5 million based on a thorough analysis of
the most probable sources of repayment, including discounted
future cash flows, liquidation of collateral or the market value of the
loan itself. As of December 31, 2004 and 2003, the specific
allowance related to impaired loans totaled $41.5 million and $28.6
million, respectively.
The second element — the general allowance for homogeneous
loan pools — is determined by applying allowance factors and
adjustments to groups of loans within the portfolio that have
similar characteristics in terms of line of business and product type.