SunTrust 2004 Annual Report Download - page 29
Download and view the complete annual report
Please find page 29 of the 2004 SunTrust annual report below. You can navigate through the pages in the report by either clicking on the pages listed below, or by using the keyword search tool below to find specific information within the annual report.-
 1
1 -
2
-
3
-
4
-
5
-
6
-
7
-
8
-
9
-
10
-
11
-
12
-
13
-
14
-
15
-
16
-
17
-
18
-
 19
19 -
 20
20 -
 21
21 -
 22
22 -
 23
23 -
 24
24 -
 25
25 -
 26
26 -
 27
27 -
 28
28 -
 29
29 -
 30
30 -
 31
31 -
 32
32 -
 33
33 -
 34
34 -
 35
35 -
 36
36 -
 37
37 -
 38
38 -
 39
39 -
40
-
41
-
42
-
43
-
44
-
45
-
46
-
47
-
48
-
49
-
50
-
51
-
52
-
53
-
54
-
55
-
56
-
57
-
58
-
59
-
60
-
61
-
62
-
63
-
64
-
65
-
66
-
67
-
68
-
69
-
70
-
71
-
72
-
73
-
74
-
75
-
76
-
77
-
78
-
79
-
80
-
81
-
82
-
83
-
84
-
85
-
86
-
87
-
88
-
89
-
90
-
91
-
92
-
93
-
94
-
95
-
96
-
97
-
98
-
99
-
100
-
101
-
102
-
103
-
104
-
105
-
106
-
107
-
108
-
109
-
110
-
111
-
112
-
113
-
114
-
115
-
116
 |
 |

MANAGEMENT’S DISCUSSION continued
SUNTRUST 2004 ANNUAL REPORT 27
Company’s prime rate averaged 4.34% for 2004, an increase of
approximately 22 basis points from 2003.The Federal Reserve Bank
Fed Funds rate averaged 1.34% for 2004, approximately 22 basis
points over the 2003 average.Another factor adding to the increase
in net interest margin has been the significant growth in lower cost
deposits, mainly Demand Deposit accounts (DDA) and NOW
accounts. Average DDA and NOW accounts increased $5.3 billion,
or 17.9%, compared to 2003. The NCF merger accounted for
approximately one-fourth of the increase.The growth in DDA and
NOW accounts replaced more expensive wholesale funding,
helping the margin improve in 2004.The margin also benefited from
the improvement in investment portfolio yield by 69 basis points
over 2003. The reasons for the improvement are covered in the
Securities Available for Sale discussion on page 36. Another factor
benefiting the margin improvement was a 76 basis point reduction
in the cost of long-term debt.The decline in rate was attributable to
shortening the duration of debt through interest rate swaps.The
shortening of debt duration improved the matching of asset and lia-
bility durations.
Average earning assets increased $9.6 billion, or 8.8%, and average
interest-bearing liabilities increased $6.9 billion, or 7.8%, versus
2003. Average earning assets for NCF were approximately $5.3 bil-
lion and average interest-bearing liabilities for NCF were approxi-
mately $4.4 billion. Average loans rose $10.1 billion, average
securities available for sale increased $2.7 billion, and average loans
held for sale decreased $3.2 billion in 2004. Loans held for sale
decreased due to a decline in mortgage production. NCF con-
tributed $3.7 billion of the average loan increase and $1.5 billion of
the average securities available for sale increase.
The Company continued to take steps to obtain alternative lower
cost funding sources, such as developing initiatives to grow cus-
tomer deposits. Campaigns to attract customer deposits were
implemented in 2003 and 2004.The Company believes that deposit
growth has also benefited from the volatility in the financial mar-
kets. Combined average NOW accounts, savings, and demand
deposits, which comprise the Company’s lower cost funding
sources, increased $6.3 billion, or 17.5%. Average NOW accounts
increased 17.7%, savings increased 15.4%, and demand deposits
increased 18.1% in 2004 over 2003. NCF contributed approxi-
mately 27.3% of the increase in these lower cost funding sources
for the year.
Interest income that the Company was unable to recognize on
nonaccrual loans had no impact on the net interest margin in 2004
and a negative impact of two basis points in 2003.
PROVISION FOR LOAN LOSSES
The provision for loan losses charged to expense is the result of a
detailed analysis estimating an appropriate and adequate ALLL.The
analysis includes the evaluation of impaired loans as prescribed
under SFAS Nos. 114 and 118, pooled loans and leases as prescribed
under SFAS No. 5, and economic and other risk factors. For the year
ended December 31, 2004, the provision for loan losses was $135.5
million, a decline of $178.1 million, or 56.8%, compared to 2003.
The decline in the provision was due to an improvement in the
credit quality of the Company’s loan and lease portfolios.
Net charge-offs for 2004 were $201.2 million, a decrease of $109.9
million, or 35.3%, from 2003. The decline was primarily due to a
$93.2 million, or 59.0%, reduction in commercial net charge-offs
(primarily within the CIB line of business), which was attributed
to continued improvement in credit quality and an increase in
recoveries. Net charge-offs in the CIB line of business totaled $16.5
million in 2004, compared to $115.0 million in 2003. Net charge-
offs related to the NCF loan portfolio were approximately $14.9
million for 2004, the majority of which related to consumer net
charge-offs.
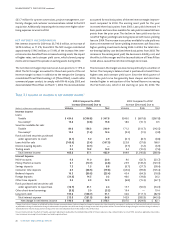
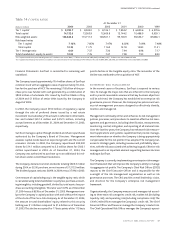
NONINTEREST INCOME
Noninterest income for 2004 was $2,604.4 million, an increase of
$301.4 million, or 13.1%, compared to 2003.Approximately $100.0
million of the increase was attributable to NCF.
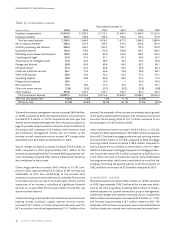
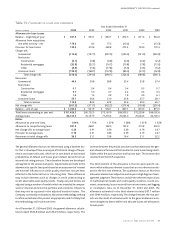
Table 4 / NONINTEREST INCOME
Year Ended December 31
(Dollars in millions) 2004 2003 2002 2001 2000 1999
Service charges on deposit accounts $ 700.0 $ 643.1 $ 612.9 $ 510.2 $ 459.7 $ 438.1
Trust and investment management income 586.8 502.4 504.5 486.1 493.9 495.6
Retail investment services 192.8 161.8 136.7 107.8 108.2 97.4
Other charges and fees 390.5 326.3 296.9 240.3 210.8 200.1
Investment banking income 206.7 192.5 177.0 108.5 111.3 67.8
Trading account profits and commissions 127.8 109.9 103.2 95.7 31.7 35.1
Card and other fees 153.4 119.6 120.0 113.6 95.7 106.2
Other income 288.1 123.5 113.1 236.6 255.7 294.7
Total noninterest income before securities
(losses) gains 2,646.1 2,179.1 2,064.3 1,898.8 1,767.0 1,735.0
Securities (losses) gains (41.7) 123.9 204.5 153.1 6.6 (109.1)
Total noninterest income $2,604.4 $2,303.0 $2,268.8 $2,051.9 $1,773.6 $1,625.9
Year-over-year growth rate in noninterest
income before securities (losses) gains 21.4% 5.6% 8.7% 7.5% 1.8%