SunTrust 2004 Annual Report Download - page 71
Download and view the complete annual report
Please find page 71 of the 2004 SunTrust annual report below. You can navigate through the pages in the report by either clicking on the pages listed below, or by using the keyword search tool below to find specific information within the annual report.-
 1
1 -
2
-
3
-
4
-
5
-
6
-
7
-
8
-
9
-
10
-
11
-
12
-
13
-
14
-
15
-
16
-
17
-
18
-
19
-
20
-
21
-
22
-
23
-
24
-
25
-
26
-
27
-
28
-
29
-
30
-
31
-
32
-
33
-
34
-
35
-
36
-
37
-
38
-
39
-
40
-
41
-
42
-
43
-
44
-
45
-
46
-
47
-
48
-
49
-
50
-
51
-
52
-
53
-
54
-
55
-
56
-
57
-
58
-
59
-
60
-
 61
61 -
 62
62 -
 63
63 -
 64
64 -
 65
65 -
 66
66 -
 67
67 -
 68
68 -
 69
69 -
 70
70 -
 71
71 -
 72
72 -
 73
73 -
 74
74 -
 75
75 -
 76
76 -
 77
77 -
 78
78 -
 79
79 -
 80
80 -
 81
81 -
82
-
83
-
84
-
85
-
86
-
87
-
88
-
89
-
90
-
91
-
92
-
93
-
94
-
95
-
96
-
97
-
98
-
99
-
100
-
101
-
102
-
103
-
104
-
105
-
106
-
107
-
108
-
109
-
110
-
111
-
112
-
113
-
114
-
115
-
116
 |
 |

SUNTRUST 2004 ANNUAL REPORT 69
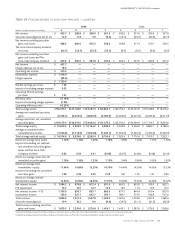
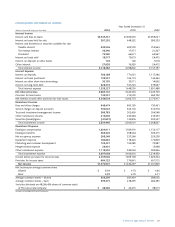
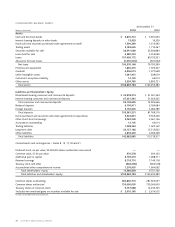
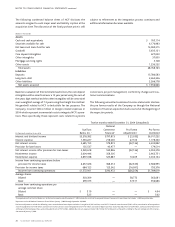
CONSOLIDATED STATEMENTS OF INCOME
Year Ended December 31
(Dollars in thousands except per share data) 2004 2003 2002
Interest Income
Interest and fees on loans $3,947,231 $3,593,630 $3,959,041
Interest on loans held for sale 281,292 448,322 280,353
Interest and dividends on securities available for sale
Taxable interest 844,526 609,500 755,664
Tax-exempt interest 26,340 17,971 21,267
Dividends172,580 66,671 62,967
Interest on funds sold 18,577 15,673 24,475
Interest on deposits in other banks 178 146 7,018
Other interest 27,658 16,929 24,412
Total interest income 5,218,382 4,768,842 5,135,197
Interest Expense
Interest on deposits 766,188 771,631 1,117,296
Interest on funds purchased 108,591 106,174 140,463
Interest on other short-term borrowings 30,195 33,511 14,062
Interest on long-term debt 628,253 537,223 619,667
Total interest expense 1,533,227 1,448,539 1,891,488
Net Interest Income 3,685,155 3,320,303 3,243,709
Provision for loan losses 135,537 313,550 469,792
Net interest income after provision for loan losses 3,549,618 3,006,753 2,773,917
Noninterest Income
Fees and other charges 943,474 800,129 730,461
Service charges on deposit accounts 700,022 643,103 612,918
Trust and investment management income 586,783 502,409 504,548
Other noninterest income 415,858 233,484 216,353
Securities (losses)/gains (41,691) 123,876 204,547
Total noninterest income 2,604,446 2,303,001 2,268,827
Noninterest Expense
Employee compensation 1,804,911 1,585,919 1,512,117
Employee benefits 363,402 358,644 306,415
Net occupancy expense 268,248 237,266 229,258
Equipment expense 184,865 178,443 174,809
Marketing and customer development 128,291 100,280 79,987
Merger-related expense 28,401 — 15,998
Other noninterest expense 1,118,920 940,064 900,836
Total noninterest expense 3,897,038 3,400,616 3,219,420
Income before provision for income taxes 2,257,026 1,909,138 1,823,324
Provision for income taxes 684,125 576,841 491,515
Net Income $1,572,901 $1,332,297 $1,331,809
Net income per average common share
Diluted $ 5.19 $ 4.73 $ 4.66
Basic 5.25 4.79 4.71
Average common shares – diluted 303,309 281,434 286,052
Average common shares – basic 299,375 278,295 282,495
1Includes dividends on 48,266,496 shares of common stock
of The Coca-Cola Company $ 48,266 $ 42,475 $ 38,613
See notes to Consolidated Financial Statements.