SunTrust 2004 Annual Report Download - page 56
Download and view the complete annual report
Please find page 56 of the 2004 SunTrust annual report below. You can navigate through the pages in the report by either clicking on the pages listed below, or by using the keyword search tool below to find specific information within the annual report.-
 1
1 -
2
-
3
-
4
-
5
-
6
-
7
-
8
-
9
-
10
-
11
-
12
-
13
-
14
-
15
-
16
-
17
-
18
-
19
-
20
-
21
-
22
-
23
-
24
-
25
-
26
-
27
-
28
-
29
-
30
-
31
-
32
-
33
-
34
-
35
-
36
-
37
-
38
-
39
-
40
-
41
-
42
-
43
-
44
-
45
-
 46
46 -
 47
47 -
 48
48 -
 49
49 -
 50
50 -
 51
51 -
 52
52 -
 53
53 -
 54
54 -
 55
55 -
 56
56 -
 57
57 -
 58
58 -
 59
59 -
 60
60 -
 61
61 -
 62
62 -
 63
63 -
 64
64 -
 65
65 -
 66
66 -
67
-
68
-
69
-
70
-
71
-
72
-
73
-
74
-
75
-
76
-
77
-
78
-
79
-
80
-
81
-
82
-
83
-
84
-
85
-
86
-
87
-
88
-
89
-
90
-
91
-
92
-
93
-
94
-
95
-
96
-
97
-
98
-
99
-
100
-
101
-
102
-
103
-
104
-
105
-
106
-
107
-
108
-
109
-
110
-
111
-
112
-
113
-
114
-
115
-
116
 |
 |

54 SUNTRUST 2004 ANNUAL REPORT
MANAGEMENT’S DISCUSSION continued
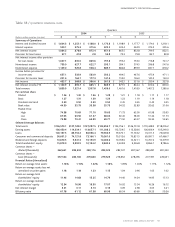
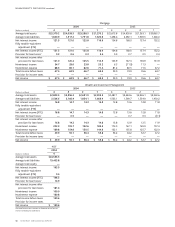
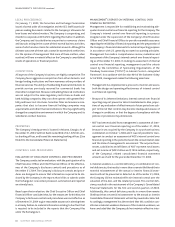
Table 21 / SUMMARY OF LOAN LOSS EXPERIENCE,NONPERFORMING ASSETS AND ACCRUING LOANS
PAST DUE 90 DAYS OR MORE
Quarters
2004 2003
(Dollars in millions) 43214321
Allowance for Loan Losses
Balance – beginning of quarter $ 893.0 $902.2 $937.0 $941.9 $941.4 $ 940.9 $ 931.1 $930.1
Allowance from acquisitions and
other activity – net 173.8 — — — — — 9.3 —
Provision for loan losses 37.1 41.8 2.8 53.8 70.3 79.8 82.7 80.8
Charge-offs (85.8) (78.2) (67.2) (84.8) (90.6) (103.6) (100.3) (99.9)
Recoveries 31.9 27.2 29.6 26.1 20.8 24.3 18.1 20.1
Balance – end of quarter $1,050.0 $893.0 $902.2 $937.0 $941.9 $ 941.4 $ 940.9 $931.1
Ratios
Allowance to quarter-end loans 1.04% 1.06% 1.09% 1.18% 1.17% 1.19% 1.25% 1.26%
Allowance to nonperforming loans 281.3 315.7 299.7 309.7 268.1 217.6 194.8 179.0
Net loan charge-offs to average loans
(annualized) 0.21 0.24 0.19 0.30 0.35 0.40 0.44 0.44
Provision to average loans (annualized) 0.15 0.20 0.01 0.27 0.35 0.41 0.45 0.45
Recoveries to total charge-offs 37.2 34.8 44.1 30.8 23.0 23.5 18.0 20.1
Nonperforming Assets
Nonaccrual loans $ 354.2 $263.2 $282.9 $283.9 $336.5 $ 423.3 $ 480.6 $520.1
Restructured loans 19.1 19.7 18.2 18.7 14.8 9.2 2.5 —
Total nonperforming loans 373.3 282.9 301.1 302.6 351.3 432.5 483.1 520.1
Other real estate owned 28.6 10.9 14.2 18.4 16.5 19.6 20.9 18.0
Other repossessed assets 8.8 10.4 9.1 10.9 10.3 11.7 11.4 10.3
Total nonperforming assets $ 410.7 $304.2 $324.4 $331.9 $378.1 $ 463.8 $ 515.4 $548.4
Ratios
Nonperforming loans to total loans 0.37 0.33 0.36 0.38 0.44 0.55 0.64 0.70
Nonperforming assets to total loans plus
OREO and other repossessed assets 0.40 0.36 0.39 0.42 0.47 0.59 0.68 0.74
Accruing Loans Past Due
90 Days or More $ 214.3 $175.8 $157.1 $173.5 $196.4 $ 228.2 $ 157.1 $165.3
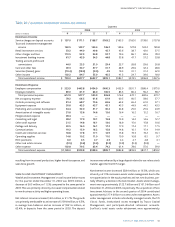
$212.4 billion, which included $24.9 billion in non-managed corpo-
rate trust assets, $39.3 billion in non-managed trust assets, and
$25.5 billion in retail brokerage assets.
Noninterest expense increased $37.7 million, or 28.5%. In addition
to expenses associated with Seix, sales staff additions and increased
incentive expense contributed to the increase.
CORPORATE/OTHER
Corporate/Other’s loss before taxes was $254.6 million compared
to a loss of $218.9 million in the fourth quarter of 2003.The fourth
quarter loss was $35.7 million, or 16.3%, larger than the prior year’s
fourth quarter loss.
Net interest income declined $0.5 million, or 1.7%, due to higher
matched-maturity funds transfer pricing allocated to the lines
of business.
The loan loss provision declined $17.1 million, compared to the
fourth quarter of 2003, as a result of improved credit quality and
the difference between the Company’s consolidated provision and
net charge-offs.
Noninterest income was $42.1 million, or 434.0%, worse than the
prior year.The primary driver of the difference was security losses of
$20.2 million in the fourth quarter of 2004 versus security gains of
$18.7 million in the fourth quarter of 2003.The security losses were
primarily from selling lower-yielding securities in order to reinvest
in higher-yielding securities to improve future income.
Noninterest expense was $10.2 million, or 4.3%, higher in 2004
than prior year.The increase was due to merger-related expenses of
$23.7 million for systems conversions, project management,
conformity changes, and customer communications related to the
NCF acquisition.