SunTrust 2004 Annual Report Download - page 52
Download and view the complete annual report
Please find page 52 of the 2004 SunTrust annual report below. You can navigate through the pages in the report by either clicking on the pages listed below, or by using the keyword search tool below to find specific information within the annual report.
50 SUNTRUST 2004 ANNUAL REPORT
MANAGEMENT’S DISCUSSION continued
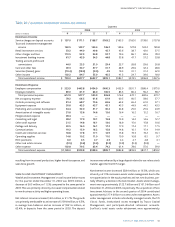
loans increased $2.9 billion, or 11.6%. Average deposits increased
$2.9 billion, or 5.4%.
With improvements in credit quality, charge-offs decreased $14.7
million, or 28.2%. Noninterest income increased $14.6 million, or
7.5%.The change was driven by higher service charges on deposit
accounts and an increase in debit card interchange volume.
Noninterest expense increased $23.9 million, or 8.8%.The higher
expense level is primarily attributable to investments in the retail
distribution network and technology.
COMMERCIAL
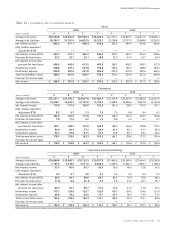
Commercial’s total income before taxes for the quarter ended
December 31, 2004 was $178.3 million, an increase of $16.2 mil-
lion, or 10.0%, compared to the same period in 2003. Higher net
interest income, lower charge-offs, and higher noninterest income
contributed to the increase.
Net interest income increased $15.9 million, or 9.5%.Average loans
increased $1.5 billion, or 6.8%, while average deposits increased
$1.8 billion, or 16.4%. Loan growth was spread across most of the
commercial loan portfolios.The growth in deposits was attributed
to increased client liquidity.
Net charge-offs decreased $7.8 million, or 81.3%, and remained at
historically low levels with overall credit quality remaining strong.
Noninterest income increased $10.4 million, or 12.9%, which was
primarily driven by additional Affordable Housing activities most of
which related to the continued consolidation of newly formed
Affordable Housing partnerships.
Noninterest expense increased $17.9 million, or 23.3%. $10.4 mil-
lion of the increase was due to additional Affordable Housing activi-
ties, most of which related to the continued consolidation of newly
formed Affordable Housing partnerships. The remainder of the
increase was primarily related to technology investments.
CORPORATE AND INVESTMENT BANKING
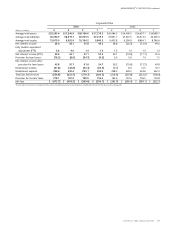
CIB’s total income before taxes for the quarter ended December 31,
2004 was $144.4 million, an increase of $15.9 million, or 12.4%,
compared to the same period in 2003. Strong performances in
derivatives, securitizations and syndicated finance offset by a
decline in net interest income contributed to that increase.
Net interest income decreased $20.7 million, or 25.8%. Excluding
the impact of the commercial paper conduit loans being on balance
sheet at the quarter ended December 31, 2003, corporate banking
loans were down approximately $374 million, or 3.9%.The decline
was primarily due to soft corporate loan demand and a reduction in
the usage of revolving credit lines. Net charge-offs decreased $7.8
million, or 118.2%, as net charge-offs returned to levels experi-
enced prior to the most recent economic downturn.
Noninterest income increased $35.2 million, or 25.5%.The increase
was primarily driven by an increase in securitizations, derivatives,
foreign exchange and syndicated finance fee income.The remainder
of the increase was the result of higher merchant banking revenue.
Noninterest expense increased $6.4 million, or 7.7%.The increase
was primarily due to an increase in asset impairment reserves
in SunTrust Equity Partners, which are carried at lower of cost
or market.
MORTGAGE
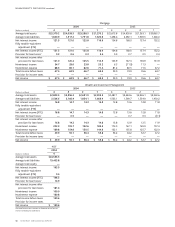
Mortgage’s total income before taxes for the quarter ended
December 31, 2004 was $67.4 million, an increase of $8.4 million, or
14.2%, compared to the same period in 2003. Earnings from higher
residential portfolio and servicing balances more than offset
the decline in earnings as a result of fewer loan sales to the
secondary market.
Net interest income decreased $13.5 million, or 10.0%.The primary
driver of this decrease was lower income from mortgage loans held
for sale which was only partially offset by higher income from resi-
dential mortgage loans held for investment and deposits. Mortgage
loans held for sale average balance decreased $1.8 billion, or 27.0%.
Combined with compressed margins, net interest income from
mortgage loans held for sale declined $27.4 million, or 39.7%.Total
average loans, principally residential mortgages held for invest-
ment, increased $4.6 billion, or 31.3%.This increase drove a $12.0
million, or 20.0%, increase in net interest income.Additionally, aver-
age deposit balances were up $91.9 million, or 7.0%, and con-
tributed $1.6 million to net interest income.
Net charge-offs decreased $0.6 million, or 66.7%. Noninterest
income increased $28.4 million, which was driven by both higher
mortgage production and mortgage servicing income. Mortgage
production was $7.9 billion in the quarter, up $1.7 billion, or 26.3%,
from the fourth quarter of 2003.The increase in mortgage produc-
tion income was driven primarily by lower hedge costs, which was
offset by lower net interest income on loans held for sale. Partially
offsetting this increase was a decrease in income from loans sold to
the secondary market. Loans sold to the secondary market were
down $1.1 billion, or 23.3%, from the fourth quarter of 2003.
Servicing income improved $7.8 million due to increased fees
from higher servicing balances and lower mortgage servicing
rights amortization. The servicing portfolio was $77.7 billion at
December 31, 2004 compared with $69.0 billion at December 31,
2003, up 12.6%.
Noninterest expense increased $7.1 million, or 8.7%.The primary
drivers of the increased expense were higher personnel expense and
expenditures related to sales promotion and growth initiatives.
Personnel expense was up due to higher commission expense


