SunTrust 2004 Annual Report Download - page 42
Download and view the complete annual report
Please find page 42 of the 2004 SunTrust annual report below. You can navigate through the pages in the report by either clicking on the pages listed below, or by using the keyword search tool below to find specific information within the annual report.-
 1
1 -
2
-
3
-
4
-
5
-
6
-
7
-
8
-
9
-
10
-
11
-
12
-
13
-
14
-
15
-
16
-
17
-
18
-
19
-
20
-
21
-
22
-
23
-
24
-
25
-
26
-
27
-
28
-
29
-
30
-
31
-
 32
32 -
 33
33 -
 34
34 -
 35
35 -
 36
36 -
 37
37 -
 38
38 -
 39
39 -
 40
40 -
 41
41 -
 42
42 -
 43
43 -
 44
44 -
 45
45 -
 46
46 -
 47
47 -
 48
48 -
 49
49 -
 50
50 -
 51
51 -
 52
52 -
53
-
54
-
55
-
56
-
57
-
58
-
59
-
60
-
61
-
62
-
63
-
64
-
65
-
66
-
67
-
68
-
69
-
70
-
71
-
72
-
73
-
74
-
75
-
76
-
77
-
78
-
79
-
80
-
81
-
82
-
83
-
84
-
85
-
86
-
87
-
88
-
89
-
90
-
91
-
92
-
93
-
94
-
95
-
96
-
97
-
98
-
99
-
100
-
101
-
102
-
103
-
104
-
105
-
106
-
107
-
108
-
109
-
110
-
111
-
112
-
113
-
114
-
115
-
116
 |
 |

40 SUNTRUST 2004 ANNUAL REPORT
MANAGEMENT’S DISCUSSION continued
horizon (i.e., the current fiscal year). Further, EVE does not take into
account factors such as future balance sheet growth, changes in
product mix, changes in yield curve relationships, and changing
product spreads that could mitigate the adverse impact of changes
in interest rates.
The net interest income simulation and valuation analyses (EVE) do
not necessarily include certain actions that management may
undertake to manage this risk in response to anticipated changes in
interest rates.
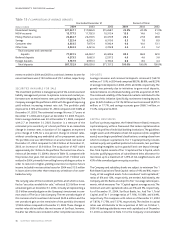
TRADING ACTIVITIES
Most of the Company’s trading activities are designed to support
secondary trading with clients. Product offerings to clients include
debt securities, including loans traded in the secondary market,
equity securities, derivatives, and foreign exchange contracts, and
similar financial instruments. Other trading activities include par-
ticipating in underwritings and acting as a market maker in certain
equity securities. Typically, the Company maintains a securities
inventory to facilitate customer transactions. However, in certain
businesses, such as derivatives, it is more common to execute cus-
tomer transactions with simultaneous risk-managing transactions
with dealers.Also in the normal course of business, the Company
assumes a degree of market risk in arbitrage, delta hedging, and
other strategies, subject to specified limits.
The Company has developed policies and procedures to manage
market risk associated with trading, capital markets and foreign
exchange activities using a value-at-risk (VaR) approach that com-
bines interest rate risk, equity risk, foreign exchange risk, spread risk,
and volatility risk. For trading portfolios,VaR measures the maxi-
mum fair value the Company could lose on a trading position, given
a specified confidence level and time horizon.VaR limits and expo-
sures are monitored daily for each significant trading portfolio.The
Company’s VaR calculation measures the potential losses in fair
value using a 99% confidence level.This equates to 2.33 standard
deviations from the mean under a normal distribution.This means
that, on average, daily profits and losses are expected to exceed VaR
one out of every 100 overnight trading days.The VaR methodology
includes holding periods for each position based upon an assess-
ment of relative trading market liquidity. For the Foreign Exchange
and Derivatives desks, the Company estimates VaR by applying the
Monte Carlo simulation platform as designed by RiskMetrics™, and
for the estimate of the Fixed Income and Equity Desks’VaR, the
Company uses Bloomberg™ analytics.The Company uses internally
developed methodology to estimate VaR for the Credit Derivatives
and Loan Trading Desks.
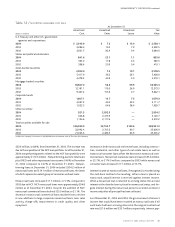
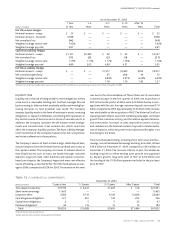
The estimated average combined Undiversified VaR (Undiversified
VaR represents a simple summation of the VaR calculated across
each Desk) was $3.0 million for 2004 and $1.8 million for 2003.
Trading assets net of trading liabilities averaged $987.8 million for
2004 and $796.3 million for 2003.The estimated combined period-
end Undiversified VaR was $3.5 million at December 31, 2004 and
$1.3 million at December 31, 2003.Trading assets net of trading lia-
bilities were $1.1 billion at December 31, 2004 and $690.3 million
at December 31, 2003.
OTHER MARKET RISK
Other sources of market risk include the risk associated with hold-
ing residential mortgage loans prior to selling them into the second-
ary mortgage market, commitments to customers to make
mortgage loans that will be sold to the secondary mortgage market,
and the Company’s investment in Mortgage Servicing Rights
(MSRs).The Company manages the risks associated with the resi-
dential mortgage loans classified as held for sale (the warehouse)
and its interest rate lock commitments (IRLCs) on residential loans
intended for sale. The warehouse and IRLCs consist primarily of
fixed- and adjustable-rate single family residential real estate loans.
The risk associated with the warehouse and IRLCs is the potential
change in interest rates between the time the customer locks in the
rate on the anticipated loan and the time the loan is sold on the sec-
ondary mortgage market, which is typically 90-150 days. The
Company manages interest rate risk predominately with forward
sale agreements, where the changes in value of the forward sale
agreements substantially offset the changes in value of the ware-
house and the IRLCs. Interest rate risk on the warehouse is managed
via forward sale agreements in a designated fair value hedging rela-
tionship, under SFAS No. 133. IRLCs on residential mortgage loans
intended for sale are classified as free standing derivative financial
instruments in accordance with SFAS No. 149 and are not desig-
nated as SFAS No. 133 hedge accounting relationships.
The value of the MSRs asset is dependent upon the assumed pre-
payment speed of the mortgage servicing portfolio. MSRs are the
discounted present value of future net cash flows that are expected
to be received from the mortgage servicing portfolio. Future
expected net cash flows from servicing a loan in the mortgage serv-
icing portfolio would not be realized if the loan pays off earlier than
anticipated. Accordingly, prepayment risk subjects the MSRs to
impairment risk.The Company does not specifically hedge the MSRs
asset for the potential impairment risk; however, it does employ a
balanced business strategy using the natural counter-cyclicality of
servicing and production to mitigate impairment risk.The fair value
determination, key economic assumptions and the sensitivity of
the current fair value of the MSRs as of December 31, 2004 and
2003 is discussed in greater detail in Note 12.
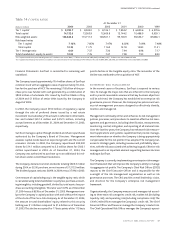
The Company is also subject to risk from changes in equity prices
that arise from owning The Coca-Cola Company common stock.
SunTrust owns 48,266,496 shares of common stock of The Coca-
Cola Company, which had a carrying value of $2.0 billion at
December 31, 2004.A 10% decrease in share price of The Coca-Cola
Company common stock at December 31, 2004 would result in a
decrease, net of deferred taxes, of approximately $130 million in
accumulated other comprehensive income.