SunTrust 2004 Annual Report Download - page 26
Download and view the complete annual report
Please find page 26 of the 2004 SunTrust annual report below. You can navigate through the pages in the report by either clicking on the pages listed below, or by using the keyword search tool below to find specific information within the annual report.-
 1
1 -
2
-
3
-
4
-
5
-
6
-
7
-
8
-
9
-
10
-
11
-
12
-
13
-
14
-
15
-
 16
16 -
 17
17 -
 18
18 -
 19
19 -
 20
20 -
 21
21 -
 22
22 -
 23
23 -
 24
24 -
 25
25 -
 26
26 -
 27
27 -
 28
28 -
 29
29 -
 30
30 -
 31
31 -
 32
32 -
 33
33 -
 34
34 -
 35
35 -
 36
36 -
37
-
38
-
39
-
40
-
41
-
42
-
43
-
44
-
45
-
46
-
47
-
48
-
49
-
50
-
51
-
52
-
53
-
54
-
55
-
56
-
57
-
58
-
59
-
60
-
61
-
62
-
63
-
64
-
65
-
66
-
67
-
68
-
69
-
70
-
71
-
72
-
73
-
74
-
75
-
76
-
77
-
78
-
79
-
80
-
81
-
82
-
83
-
84
-
85
-
86
-
87
-
88
-
89
-
90
-
91
-
92
-
93
-
94
-
95
-
96
-
97
-
98
-
99
-
100
-
101
-
102
-
103
-
104
-
105
-
106
-
107
-
108
-
109
-
110
-
111
-
112
-
113
-
114
-
115
-
116
 |
 |

24 SUNTRUST 2004 ANNUAL REPORT
MANAGEMENT’S DISCUSSION continued
pated in a rising rate environment as clients earn a higher credit on
their deposits.
Noninterest expense increased $67.8 million, or 23.8%. Affordable
Housing activities, primarily related to the consolidation of certain
Affordable Housing partnerships as a result of the Company becom-
ing the general partner in the third quarter 2003, accounted for
$45.9 million of the increase.The remainder of the increase was pri-
marily related to technology investments.
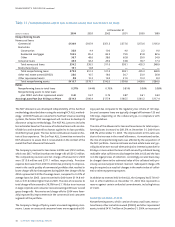
CORPORATE AND INVESTMENT BANKING
CIB’s total income before taxes for the year ended December 31,
2004 was $538.6 million, an increase of $114.6 million, or 27.0%,
compared to 2003.A significant improvement in net charge-offs
and noninterest income contributed to the increase.
Net interest income decreased $36.3 million, or 12.2%, which was
primarily driven by a $2.4 billion, or 14.9%, decline in average loan
balances due to a weaker corporate loan demand and lower usage
of revolving credit lines.
Net charge-offs decreased $98.5 million, or 85.7%, as net charge-
offs returned to levels experienced prior to the most recent eco-
nomic downturn.
Noninterest income increased $67.6 million, or 12.3%, which was
driven by an increase in revenues from merchant banking coupled
with an increase in equity capital markets revenue.
Noninterest expense increased $15.2 million, or 4.9%, which was
due primarily to an increase in personnel expense of $11.8 million,
or 6.1%.The increase in personnel expense was driven by increased
variable compensation associated with increased fee income.
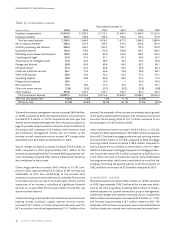
MORTGAGE
Mortgage’s total income before taxes for the year ended December
31, 2004 was $261.4 million, a decrease of $13.9 million, or 5.0%,
compared to 2003. Declines in production income were only par-
tially offset by increased earnings due to both lower servicing amor-
tization and higher servicing fees, as well as higher income from
growth in the residential mortgage portfolio.
Net interest income decreased $87.5 million, or 15.3%.The primary
driver of this decrease was lower income from mortgage loans held
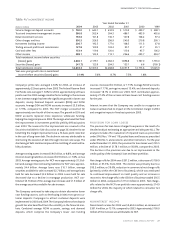
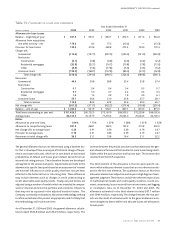
The following table for SunTrust’s reportable business segments compares total income before taxes for the twelve months ended
December 31, 2004 to the same period last year:
TABLE 1 / TOTAL INCOME BEFORE TAXES
(Dollars in millions) 2004 2003
Retail $1,375.3 $1,260.7
Commercial 659.9 635.2
Corporate and Investment Banking 538.6 424.1
Mortgage 261.4 275.3
Wealth and Investment Management 217.1 200.2
NCF (acquired October 1, 2004) 120.5 —
Corporate/Other (857.5) (841.3)
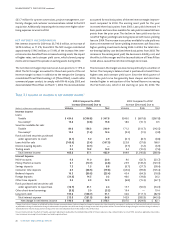
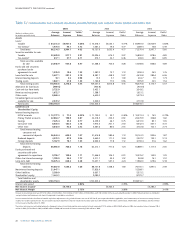
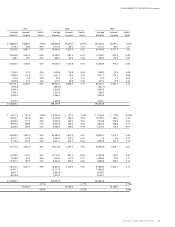
The following table for SunTrust’s reportable business segments compares average loans and average deposits for the twelve months ended
December 31, 2004 to the same period last year:
TABLE 2 / AVERAGE LOANS AND DEPOSITS
2004 2003 2004 2003
Average Average Average Average
(Dollars in millions) loans loans deposits deposits
Retail $26,419.0 $23,619.8 $54,841.0 $52,889.1
Commercial 22,500.0 21,251.4 12,139.1 10,542.3
Corporate and Investment Banking 13,539.0 15,906.4 3,233.8 2,909.7
Mortgage 17,644.2 13,221.4 1,381.1 1,634.4
Wealth and Investment Management 2,273.6 2,001.2 1,960.9 1,480.5
NCF (acquired October 1, 2004) 3,659.0 —3,941.6 —