SunTrust 2004 Annual Report Download - page 57
Download and view the complete annual report
Please find page 57 of the 2004 SunTrust annual report below. You can navigate through the pages in the report by either clicking on the pages listed below, or by using the keyword search tool below to find specific information within the annual report.-
 1
1 -
2
-
3
-
4
-
5
-
6
-
7
-
8
-
9
-
10
-
11
-
12
-
13
-
14
-
15
-
16
-
17
-
18
-
19
-
20
-
21
-
22
-
23
-
24
-
25
-
26
-
27
-
28
-
29
-
30
-
31
-
32
-
33
-
34
-
35
-
36
-
37
-
38
-
39
-
40
-
41
-
42
-
43
-
44
-
45
-
46
-
 47
47 -
 48
48 -
 49
49 -
 50
50 -
 51
51 -
 52
52 -
 53
53 -
 54
54 -
 55
55 -
 56
56 -
 57
57 -
 58
58 -
 59
59 -
 60
60 -
 61
61 -
 62
62 -
 63
63 -
 64
64 -
 65
65 -
 66
66 -
 67
67 -
68
-
69
-
70
-
71
-
72
-
73
-
74
-
75
-
76
-
77
-
78
-
79
-
80
-
81
-
82
-
83
-
84
-
85
-
86
-
87
-
88
-
89
-
90
-
91
-
92
-
93
-
94
-
95
-
96
-
97
-
98
-
99
-
100
-
101
-
102
-
103
-
104
-
105
-
106
-
107
-
108
-
109
-
110
-
111
-
112
-
113
-
114
-
115
-
116
 |
 |

MANAGEMENT’S DISCUSSION continued
SUNTRUST 2004 ANNUAL REPORT 55
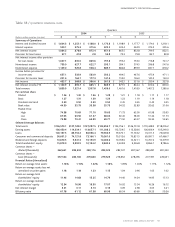
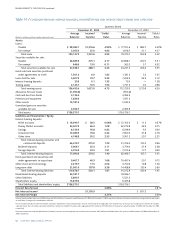
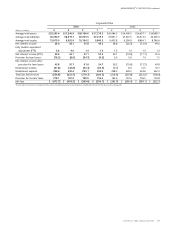
Table 22 / QUARTERLY LINE OF BUSINESS RESULTS
Retail
2004 2003
(Dollars in millions) 4321 43 21
Average total assets $30,390.8 $29,640.8 $29,399.4 $28,426.2 $27,475.1 $26,934.7 $26,217.3 $25,845.1
Average total liabilities 56,390.7 55,181.0 54,655.9 53,525.7 53,558.8 53,357.0 52,948.8 52,263.9
Net interest income 493.5 471.1 446.3 444.3 450.5 444.1 433.0 418.6
Fully taxable-equivalent
adjustment (FTE) ————————
Net interest income (FTE) 493.5 471.1 446.3 444.3 450.5 444.1 433.0 418.6
Provision for loan losses137.5 29.1 33.1 38.8 52.2 41.9 33.7 43.3
Net interest income after
provision for loan losses 456.0 442.0 413.2 405.5 398.3 402.2 399.3 375.3
Noninterest income 208.8 207.2 207.8 193.8 194.2 193.7 188.9 184.3
Noninterest expense 296.8 287.6 291.8 282.8 272.9 270.3 267.2 265.0
Total income before taxes 368.0 361.6 329.2 316.5 319.6 325.6 321.0 294.6
Provision for income taxes ————————
Net income $ 368.0 $ 361.6 $ 329.2 $ 316.5 $ 319.6 $ 325.6 $ 321.0 $ 294.6
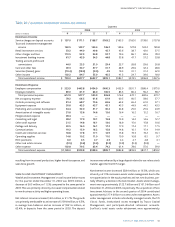
Commercial
2004 2003
(Dollars in millions) 4321 43 21
Average total assets $25,251.1 $24,759.7 $24,607.8 $23,987.4 $23,725.8 $23,635.9 $23,280.0 $22,367.6
Average total liabilities 13,418.7 12,632.7 12,127.0 11,740.0 11,548.2 10,996.6 10,327.3 10,125.8
Net interest income 175.6 171.3 164.5 163.5 161.0 158.5 155.9 150.7
Fully taxable-equivalent
adjustment (FTE) 8.3 8.7 7.3 7.2 7.0 6.8 6.4 6.1
Net interest income (FTE) 183.9 180.0 171.8 170.7 168.0 165.3 162.3 156.8
Provision for loan losses11.8 11.5 4.2 7.5 9.6 4.7 2.5 2.7
Net interest income after
provision for loan losses 182.1 168.5 167.6 163.2 158.4 160.6 159.8 154.1
Noninterest income 90.9 80.3 77.2 83.3 80.5 83.1 61.7 62.5
Noninterest expense 94.7 95.8 81.5 81.2 76.8 84.1 64.2 60.2
Total income before taxes 178.3 153.0 163.3 165.3 162.1 159.6 157.3 156.4
Provision for income taxes ————————
Net income $ 178.3 $ 153.0 $ 163.3 $ 165.3 $ 162.1 $ 159.6 $ 157.3 $ 156.4
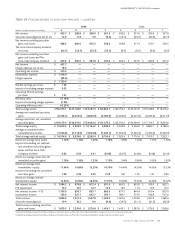
Corporate & Investment Banking
2004 2003
(Dollars in millions) 4321 43 21
Average total assets $18,890.6 $18,565.7 $19,123.3 $20,557.2 $21,469.9 $24,349.4 $21,444.5 $22,268.6
Average total liabilities 7,137.6 7,018.0 7,611.0 8,348.3 9,340.0 11,642.1 7,560.1 7,738.4
Net interest income 55.0 60.6 65.7 63.0 76.6 68.9 72.8 65.2
Fully taxable-equivalent
adjustment (FTE) 4.5 4.1 3.9 3.7 3.6 3.5 3.2 3.1
Net interest income (FTE) 59.5 64.7 69.6 66.7 80.2 72.4 76.0 68.3
Provision for loan losses1(1.2) 8.6 (0.1) 9.3 6.6 31.2 44.1 33.1
Net interest income after
provision for loan losses 60.7 56.1 69.7 57.4 73.6 41.2 31.9 35.2
Noninterest income 173.5 158.6 153.7 132.8 138.3 134.2 154.6 123.9
Noninterest expense 89.8 76.2 83.0 75.1 83.4 79.7 74.4 71.5
Total income before taxes 144.4 138.5 140.4 115.1 128.5 95.7 112.1 87.6
Provision for income taxes ————————
Net income $ 144.4 $ 138.5 $ 140.4 $ 115.1 $ 128.5 $ 95.7 $ 112.1 $ 87.6
1Provision for loan losses includes an allocation to the lines of business reflecting net credit losses.