SunTrust 2004 Annual Report Download - page 89
Download and view the complete annual report
Please find page 89 of the 2004 SunTrust annual report below. You can navigate through the pages in the report by either clicking on the pages listed below, or by using the keyword search tool below to find specific information within the annual report.-
 1
1 -
2
-
3
-
4
-
5
-
6
-
7
-
8
-
9
-
10
-
11
-
12
-
13
-
14
-
15
-
16
-
17
-
18
-
19
-
20
-
21
-
22
-
23
-
24
-
25
-
26
-
27
-
28
-
29
-
30
-
31
-
32
-
33
-
34
-
35
-
36
-
37
-
38
-
39
-
40
-
41
-
42
-
43
-
44
-
45
-
46
-
47
-
48
-
49
-
50
-
51
-
52
-
53
-
54
-
55
-
56
-
57
-
58
-
59
-
60
-
61
-
62
-
63
-
64
-
65
-
66
-
67
-
68
-
69
-
70
-
71
-
72
-
73
-
74
-
75
-
76
-
77
-
78
-
 79
79 -
 80
80 -
 81
81 -
 82
82 -
 83
83 -
 84
84 -
 85
85 -
 86
86 -
 87
87 -
 88
88 -
 89
89 -
 90
90 -
 91
91 -
 92
92 -
 93
93 -
 94
94 -
 95
95 -
 96
96 -
 97
97 -
 98
98 -
 99
99 -
100
-
101
-
102
-
103
-
104
-
105
-
106
-
107
-
108
-
109
-
110
-
111
-
112
-
113
-
114
-
115
-
116
 |
 |

NOTES TO CONSOLIDATED FINANCIAL STATEMENTS continued
SUNTRUST 2004 ANNUAL REPORT 87
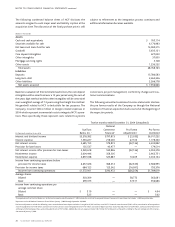
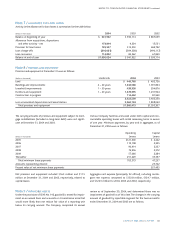
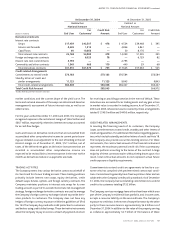
Principal amounts due for the next five years on long-term debt are:
2005 – $3,584.6 million; 2006 – $2,838.7 million; 2007 – $885.4
million; 2008 – $2,979.9 million; and 2009 – $1,134.2 million.
Restrictive provisions of several long-term debt agreements pre-
vent the Company from creating liens on, disposing of, or issuing
(except to related parties) voting stock of subsidiaries. Further,
there are restrictions on mergers, consolidations, certain leases,
sales or transfers of assets, minimum shareholders’equity, and max-
imum borrowings by the Company. As of December 31, 2004, the
Company was in compliance with all covenants and provisions of
long-term debt agreements. Long-term debt of $1,884.0 million
and $1,650.0 million as of December 31, 2004 and 2003, re-
spectively, qualified as Tier 1 capital.As currently defined by federal
bank regulators, long-term debt of $2,404.2 million and $2,380.7
million as of December 31, 2004 and 2003, respectively, qualified as
Tier 2 capital.
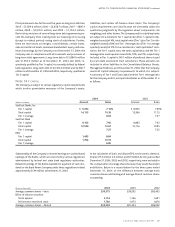
Note 14 / CAPITAL
The Company is subject to various regulatory capital requirements
which involve quantitative measures of the Company’s assets,
liabilities, and certain off-balance sheet items. The Company’s
capital requirements and classification are ultimately subject to
qualitative judgments by the regulators about components, risk
weightings, and other factors.The Company and its subsidiary banks
are subject to a minimum Tier 1 capital ratio (Tier 1 capital to risk-
weighted assets) of 4%, total capital ratio (Tier 1 plus Tier 2 to risk-
weighted assets) of 8% and Tier 1 leverage ratio (Tier 1 to average
quarterly assets) of 3%.To be considered a “well capitalized” insti-
tution, the Tier 1 capital ratio, the total capital ratio, and the Tier 1
leverage ratio must equal or exceed 6%, 10%, and 5%, respectively.
Included in Tier 1 capital is $451 million of preferred shares issued
by real estate investment trust subsidiaries. These amounts are
included in other liabilities in the Consolidated Balance Sheets.
Management believes, as of December 31, 2004, that the Company
meets all capital adequacy requirements to which it is subject.
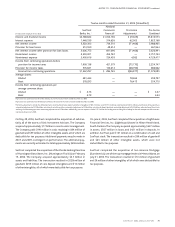
A summary of Tier 1 and Total capital and the Tier 1 leverage ratio
for the Company and its principal subsidiaries as of December 31 is
as follows:
2004 2003
(Dollars in millions) Amount Ratio Amount Ratio
SunTrust Banks, Inc.
Tier 1 capital $ 9,784 7.16% $ 8,930 7.85%
Total capital 14,153 10.36 13,366 11.75
Tier 1 leverage 6.64 7.37
SunTrust Bank
Tier 1 capital 9,162 7.80 8,883 7.92
Total capital 12,539 10.67 12,176 10.85
Tier 1 leverage 7.27 7.35
NBC
Tier 1 capital 1,483 8.84
Total capital 1,766 10.53
Tier 1 leverage 6.80
Substantially all the Company’s retained earnings are undistributed
earnings of the Banks, which are restricted by various regulations
administered by federal and state bank regulatory authorities.
Retained earnings of the Banks available for payment of cash divi-
dends to the Bank Parent Company under these regulations totaled
approximately $544 million at December 31, 2004.
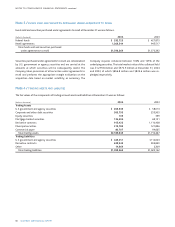
In the calculation of basic and diluted EPS, net income is identical.
Shares of 5.3 million, 2.2 million, and 8.9 million for the years ended
December 31, 2004, 2003, and 2002, respectively, were excluded in
the computation of average shares because they would have been
antidilutive. Below is a reconciliation for the three years ended
December 31, 2004, of the difference between average basic
common shares outstanding and average diluted common shares
outstanding.
(Shares in thousands) 2004 2003 2002
Average common shares – basic 299,375 278,295 282,495
Effect of dilutive securities
Stock options 2,154 1,166 1,681
Performance restricted stock 1,780 1,973 1,876
Average common shares – diluted 303,309 281,434 286,052