SunTrust 2004 Annual Report Download - page 104
Download and view the complete annual report
Please find page 104 of the 2004 SunTrust annual report below. You can navigate through the pages in the report by either clicking on the pages listed below, or by using the keyword search tool below to find specific information within the annual report.-
 1
1 -
2
-
3
-
4
-
5
-
6
-
7
-
8
-
9
-
10
-
11
-
12
-
13
-
14
-
15
-
16
-
17
-
18
-
19
-
20
-
21
-
22
-
23
-
24
-
25
-
26
-
27
-
28
-
29
-
30
-
31
-
32
-
33
-
34
-
35
-
36
-
37
-
38
-
39
-
40
-
41
-
42
-
43
-
44
-
45
-
46
-
47
-
48
-
49
-
50
-
51
-
52
-
53
-
54
-
55
-
56
-
57
-
58
-
59
-
60
-
61
-
62
-
63
-
64
-
65
-
66
-
67
-
68
-
69
-
70
-
71
-
72
-
73
-
74
-
75
-
76
-
77
-
78
-
79
-
80
-
81
-
82
-
83
-
84
-
85
-
86
-
87
-
88
-
89
-
90
-
91
-
92
-
93
-
 94
94 -
 95
95 -
 96
96 -
 97
97 -
 98
98 -
 99
99 -
 100
100 -
 101
101 -
 102
102 -
 103
103 -
 104
104 -
 105
105 -
 106
106 -
 107
107 -
 108
108 -
 109
109 -
 110
110 -
 111
111 -
 112
112 -
 113
113 -
 114
114 -
115
-
116
 |
 |

102 SUNTRUST 2004 ANNUAL REPORT
NOTES TO CONSOLIDATED FINANCIAL STATEMENTS continued
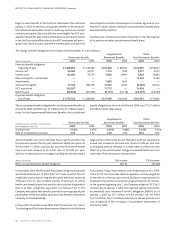
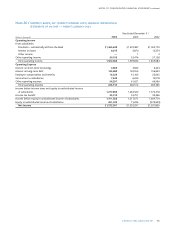
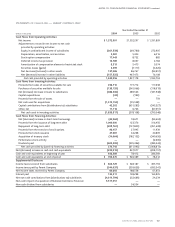
The tables below disclose selected financial information for SunTrust’s reportable business segments for the twelve months ended
December 31, 2004, 2003, and 2002.
Twelve Months Ended December 31, 2004
Corporate & Wealth and
Investment Investment Corporate/
(Dollars in thousands) Retail Commercial Banking Mortgage Management NCF Other Consolidated
Average total assets $29,467,302 $24,653,432 $19,281,182 $23,505,768 $2,686,121 $6,171,907 $27,988,581 $133,754,293
Average total liabilities 54,942,949 12,482,582 7,526,233 1,547,700 2,049,187 4,877,970 38,858,190 122,284,811
Average total equity — — — — — — 11,469,482 11,469,482
Net interest income $ 1,855,157 $ 674,904 $ 244,392 $ 485,020 $ 60,629 $ 195,966 $ 169,087 $ 3,685,155
Fully taxable-equivalent
adjustment (FTE) 78 31,538 16,236 — 8 353 10,185 58,398
Net interest income (FTE)11,855,235 706,442 260,628 485,020 60,637 196,319 179,272 3,743,553
Provision for loan losses2138,520 25,017 16,497 3,676 531 14,900 (63,604) 135,537
Net interest income after
provision for loan losses 1,716,715 681,425 244,131 481,344 60,106 181,419 242,876 3,608,016
Noninterest income 817,618 331,695 618,640 107,424 776,428 99,986 (147,345) 2,604,446
Noninterest expense 1,159,048 353,176 324,128 327,361 619,415 160,845 953,065 3,897,038
Total contribution before taxes 1,375,285 659,944 538,643 261,407 217,119 120,560 (857,534) 2,315,424
Provision for income taxes3— — — — — — 742,523 742,523
Net income $ 1,375,285 $ 659,944 $ 538,643 $ 261,407 $ 217,119 $ 120,560 $ (1,600,057) $ 1,572,901
Twelve Months Ended December 31, 2003
Corporate & Wealth and
Investment Investment Corporate/
(Dollars in thousands) Retail Commercial Banking Mortgage Management Other Consolidated
Average total assets $26,623,936 $23,257,092 $22,386,296 $22,509,803 $2,301,156 $25,247,078 $122,325,361
Average total liabilities 53,036,587 10,754,043 9,081,569 1,800,908 1,529,679 37,039,549 113,242,335
Average total equity — — — — — 9,083,026 9,083,026
Net interest income $ 1,746,158 $ 625,979 $ 283,538 $ 572,501 $ 51,982 $ 40,145 $ 3,320,303
Fully taxable-equivalent
adjustment (FTE) 71 26,316 13,369 — 11 5,247 45,014
Net interest income (FTE)11,746,229 652,295 296,907 572,501 51,993 45,392 3,365,317
Provision for loan losses2171,185 19,494 114,965 2,479 928 4,499 313,550
Net interest income after
provision for loan losses 1,575,044 632,801 181,942 570,022 51,065 40,893 3,051,767
Noninterest income 761,068 287,795 551,029 5,698 664,677 32,734 2,303,001
Noninterest expense 1,075,396 285,361 308,896 300,460 515,575 914,928 3,400,616
Total contribution before taxes 1,260,716 635,235 424,075 275,260 200,167 (841,301) 1,954,152
Provision for income taxes3— — — — — 621,855 621,855
Net income $ 1,260,716 $ 635,235 $ 424,075 $ 275,260 $ 200,167 $ (1,463,156) $ 1,332,297
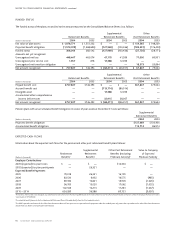
Twelve Months Ended December 31, 2002
Corporate & Wealth and
Investment Investment Corporate/
(Dollars in thousands) Retail Commercial Banking Mortgage Management Other Consolidated
Average total assets $24,321,753 $20,977,234 $21,686,361 $18,692,058 $1,861,801 $20,976,889 $108,516,096
Average total liabilities 51,679,943 8,817,108 6,364,551 1,265,271 1,562,074 30,101,442 99,790,389
Average total equity — — — — — 8,725,707 8,725,707
Net interest income $ 1,658,939 $ 538,800 $ 269,334 $ 399,536 $ 47,064 $ 330,036 $ 3,243,709
Fully taxable-equivalent
adjustment (FTE) 187 22,582 11,050 — 17 5,686 39,522
Net interest income (FTE)11,659,126 561,382 280,384 399,536 47,081 335,722 3,283,231
Provision for loan losses2165,381 18,131 241,483 1,957 140 42,700 469,792
Net interest income after
provision for loan losses 1,493,745 543,251 38,901 397,579 46,941 293,022 2,813,439
Noninterest income 730,640 215,209 530,037 1,442 630,721 160,778 2,268,827
Noninterest expense 1,070,289 270,931 312,872 227,208 476,921 861,199 3,219,420
Total contribution before taxes 1,154,096 487,529 256,066 171,813 200,741 (407,399) 1,862,846
Provision for income taxes3— — — — — 531,037 531,037
Net income $ 1,154,096 $ 487,529 $ 256,066 $ 171,813 $ 200,741 $ (938,436) $ 1,331,809
1Net interest income is fully taxable equivalent and is presented on a matched maturity funds transfer price basis for the line of business.
2Provision for loan losses includes an allocation to the lines of business reflecting net credit losses.
3Includes regular income tax provision and taxable-equivalent income adjustment reversal of $58.4 million, $45.0 million, and $39.5 million for the twelve months ended December 31,
2004, 2003 and 2002 respectively.