SunTrust 2004 Annual Report Download - page 74
Download and view the complete annual report
Please find page 74 of the 2004 SunTrust annual report below. You can navigate through the pages in the report by either clicking on the pages listed below, or by using the keyword search tool below to find specific information within the annual report.-
 1
1 -
2
-
3
-
4
-
5
-
6
-
7
-
8
-
9
-
10
-
11
-
12
-
13
-
14
-
15
-
16
-
17
-
18
-
19
-
20
-
21
-
22
-
23
-
24
-
25
-
26
-
27
-
28
-
29
-
30
-
31
-
32
-
33
-
34
-
35
-
36
-
37
-
38
-
39
-
40
-
41
-
42
-
43
-
44
-
45
-
46
-
47
-
48
-
49
-
50
-
51
-
52
-
53
-
54
-
55
-
56
-
57
-
58
-
59
-
60
-
61
-
62
-
63
-
 64
64 -
 65
65 -
 66
66 -
 67
67 -
 68
68 -
 69
69 -
 70
70 -
 71
71 -
 72
72 -
 73
73 -
 74
74 -
 75
75 -
 76
76 -
 77
77 -
 78
78 -
 79
79 -
 80
80 -
 81
81 -
 82
82 -
 83
83 -
 84
84 -
85
-
86
-
87
-
88
-
89
-
90
-
91
-
92
-
93
-
94
-
95
-
96
-
97
-
98
-
99
-
100
-
101
-
102
-
103
-
104
-
105
-
106
-
107
-
108
-
109
-
110
-
111
-
112
-
113
-
114
-
115
-
116
 |
 |

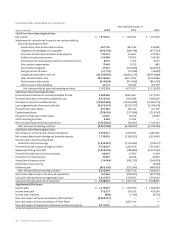
72 SUNTRUST 2004 ANNUAL REPORT
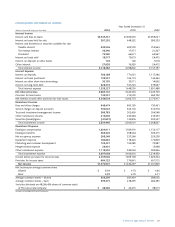
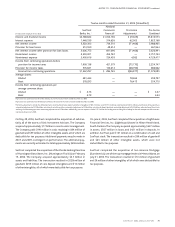
CONSOLIDATED STATEMENTS OF CASH FLOW
Year Ended December 31
(Dollars in thousands) 2004 2003 2002
Cash Flows from Operating Activities:
Net income $ 1,572,901 $ 1,332,297 $ 1,331,809
Adjustments to reconcile net income to net cash provided by
(used in) operating activities:
Depreciation, amortization and accretion 667,145 881,542 619,965
Origination of mortgage servicing rights (196,118) (384,198) (277,343)
Provisions for loan losses and foreclosed property 137,032 314,667 470,730
Deferred income tax provision 144,988 179,905 146,326
Amortization of compensation element of restricted stock 8,515 5,475 3,074
Stock option compensation 17,443 8,722 885
Securities losses (gains) 41,691 (123,876) (204,547)
Net gain on sale of assets (11,175) (12,596) (16,030)
Originated loans held for sale, net (30,194,087) (43,816,219) (28,954,686)
Sales of loans held for sale 29,516,696 46,011,952 25,526,486
Net increase in other assets (616,943) (451,686) (861,295)
Net increase in other liabilities 44,115 124,222 702,199
Net cash provided by (used in) operating activities 1,132,203 4,070,207 (1,512,427)
Cash Flows from Investing Activities:
Proceeds from maturities of securities available for sale 5,083,485 10,841,607 5,217,479
Proceeds from sales of securities available for sale 8,875,126 7,633,468 5,626,929
Purchases of securities available for sale (12,264,430) (19,933,984) (14,687,010)
Loan originations net of principal collected (9,555,401) (5,533,737) (2,744,616)
Proceeds from sale of loans 357,785 392,412 721,195
Capital expenditures (238,009) (157,608) (123,245)
Proceeds from the sale of other assets 37,427 39,324 29,599
Other investing activities 2,584 13,932 —
Net cash (used for) provided by acquisitions (1,265,650) (34,261) 1,160,333
Net cash used in investing activities (8,967,083) (6,738,847) (4,799,336)
Cash Flows from Financing Activities:
Net increase in consumer and commercial deposits 5,254,911 2,404,052 3,481,945
Net increase (decrease) in foreign and brokered deposits 1,135,626 (1,328,925) 4,224,638
Net decrease in funds purchased and
other short-term borrowings (1,439,497) (1,120,063) (190,677)
Proceeds from the issuance of long-term debt 4,728,616 3,281,676 1,451,692
Repayment of long-term debt (1,203,676) (189,686) (2,227,527)
Proceeds from the exercise of stock options 96,457 27,945 11,939
Proceeds from stock issuance 47,381 44,268 40,809
Acquisition of treasury stock (14,064) (182,152) (340,656)
Performance stock activity —— (2,606)
Dividends paid (603,309) (505,396) (489,543)
Net cash provided by financing activities 8,002,445 2,431,719 5,960,014
Net increase (decrease) in cash and cash equivalents 167,565 (236,921) (351,749)
Cash and cash equivalents at beginning of year 5,321,374 5,558,295 5,910,044
Cash and cash equivalents at end of period $ 5,488,939 $ 5,321,374 $ 5,558,295
Supplemental Disclosure
Interest paid $ 1,472,807 $ 1,465,030 $ 1,926,320
Income taxes paid 575,537 359,526 450,249
Income taxes refunded (809) (1,136) (9,731)
Non-cash impact of the deconsolidation of Three Pillars (2,563,031) ——
Non-cash impact of the consolidation of Three Pillars —2,857,316 —
Non-cash impact of acquisition of National Commerce Financial 5,517,551 ——
See notes to Consolidated Financial Statements.