SunTrust 2004 Annual Report Download - page 33
Download and view the complete annual report
Please find page 33 of the 2004 SunTrust annual report below. You can navigate through the pages in the report by either clicking on the pages listed below, or by using the keyword search tool below to find specific information within the annual report.-
 1
1 -
2
-
3
-
4
-
5
-
6
-
7
-
8
-
9
-
10
-
11
-
12
-
13
-
14
-
15
-
16
-
17
-
18
-
19
-
20
-
21
-
22
-
 23
23 -
 24
24 -
 25
25 -
 26
26 -
 27
27 -
 28
28 -
 29
29 -
 30
30 -
 31
31 -
 32
32 -
 33
33 -
 34
34 -
 35
35 -
 36
36 -
 37
37 -
 38
38 -
 39
39 -
 40
40 -
 41
41 -
 42
42 -
 43
43 -
44
-
45
-
46
-
47
-
48
-
49
-
50
-
51
-
52
-
53
-
54
-
55
-
56
-
57
-
58
-
59
-
60
-
61
-
62
-
63
-
64
-
65
-
66
-
67
-
68
-
69
-
70
-
71
-
72
-
73
-
74
-
75
-
76
-
77
-
78
-
79
-
80
-
81
-
82
-
83
-
84
-
85
-
86
-
87
-
88
-
89
-
90
-
91
-
92
-
93
-
94
-
95
-
96
-
97
-
98
-
99
-
100
-
101
-
102
-
103
-
104
-
105
-
106
-
107
-
108
-
109
-
110
-
111
-
112
-
113
-
114
-
115
-
116
 |
 |

MANAGEMENT’S DISCUSSION continued
SUNTRUST 2004 ANNUAL REPORT 31
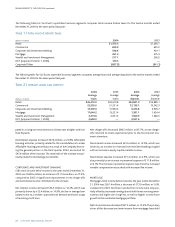
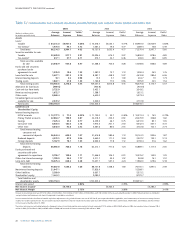
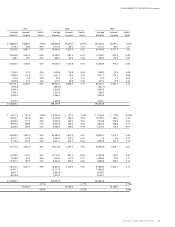
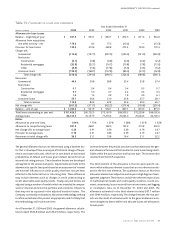
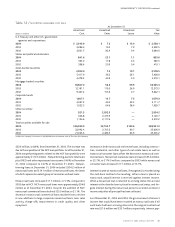
Table 7 / LOAN PORTFOLIO BY TYPES OF LOANS
At December 31
(Dollars in millions) 2004 2003 2002 2001 2000 1999
Commercial $ 31,823.8 $30,681.9 $28,693.6 $28,945.9 $30,781.1 $26,933.5
Real estate
Home equity 11,519.2 6,965.3 5,194.8 2,776.7 2,332.8 1,927.7
Construction 7,845.4 4,479.8 4,002.4 3,627.3 2,966.1 2,457.1
Residential mortgages 24,553.5 17,208.1 14,248.6 14,520.4 17,620.2 17,691.6
Other 12,083.8 9,330.1 9,101.8 8,152.0 8,121.4 7,794.9
Credit card 175.3 133.0 111.3 92.0 76.8 77.4
Consumer loans 13,425.2 11,934.1 11,815.4 10,844.9 10,341.4 9,120.6
Total loans $101,426.2 $80,732.3 $73,167.9 $68,959.2 $72,239.8 $66,002.8
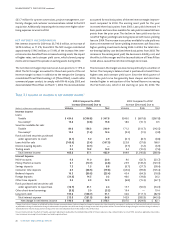
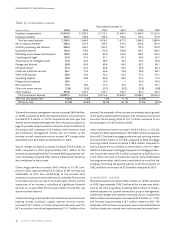
tive costs. Headcount increased from 27,578 at December 31, 2003,
to 33,156 at December 31, 2004, and included approximately 5,206
due to the acquisition of NCF.The increase in incentives was prima-
rily due to an increase in commission and performance-based incen-
tives due to strong business volumes in the Wealth and Investment
Management, Retail, Commercial, and CIB lines of business.
Net occupancy expense increased $30.9 million, or 13.0%, com-
pared to December 31, 2003. The NCF acquisition represented
approximately $12.5 million of the increase.The remaining increase
was primarily attributed to increases in rent, utility, and mainte-
nance costs, primarily related to investments in the retail distribu-
tion network.
Noninterest expense was further impacted by a $39.6 million, or
16.1%, increase in outside processing and software expenses prima-
rily due to higher software amortization and maintenance expense.
The increase in outside processing and software expenses included
approximately $8.5 million related to the NCF acquisition.
Marketing and customer development expense increased $28.0
million, or 27.9%, primarily due to the Company’s “Banking that
doesn’t interrupt your life” campaign that ran throughout 2004 and
promoted the convenience of banking with SunTrust. In addition,
the increase in marketing and customer development was attrib-
uted to the Company’s sponsorship of the Grand American Rolex
Sports Car Series. NCF represented approximately $4.2 million of
the overall increase in marketing and customer development.
Consulting and legal expenses increased $23.6 million, or 41.1%, of
which NCF represented $3.8 million.The remainder of the increase
was primarily attributed to revenue enhancement, process
improvement, and cost control initiatives.
Other noninterest expense increased $85.1 million, or 33.4%.
Approximately $15.6 million of the increase was attributed to
NCF. Certain Affordable Housing partnerships, which were consoli-
dated as a result of the Company becoming the general partner in
the third quarter of 2003, resulted in an increase of $42.0 million
compared to 2003. This increase included a $9.0 million asset
impairment charge based on a valuation analysis performed as of
September 30, 2004.
The efficiency ratio increased to 61.4% in 2004 compared to 60.0%
in 2003. On an operating basis, which excludes merger-related
expenses, the efficiency ratio was 60.9% for 2004.
PROVISION FOR INCOME TAXES
The provision for income taxes includes both federal and state
income taxes. In 2004, the provision was $684.1 million, compared
to $576.8 million in 2003.The provision represents an effective tax
rate of 30.3% for 2004 compared to 30.2% for 2003.
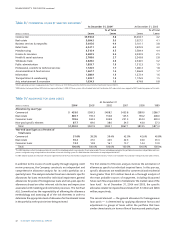
LOANS
The Company’s loan portfolio increased $20.7 billion, or 25.6%,
from December 31, 2003 to December 31, 2004. NCF contributed
approximately $14.8 billion of the increase.The remainder of the
increase was primarily due to increases in residential mortgages and
home equity loans for historical SunTrust.The increase in residential
mortgages was due to slightly higher rates, thus causing an
improvement in adjustable rate mortgage production, which the
Company tends to retain in its portfolio. The increase in home
equity lines was due to better products, sales focus, and cross-
selling efforts.Commercial loans on a historical SunTrust basis were
up slightly taking into account the 2004 deconsolidation of Three
Pillars.The 2003 balance included $2.8 billion of commercial loans
related to Three Pillars.The loan portfolio continues to be well diver-
sified from both a product and industry concentration standpoint
with real estate loans accounting for the largest segment.
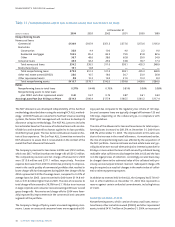
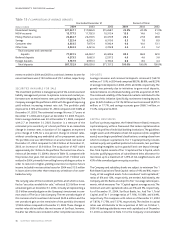
ALLOWANCE FOR LOAN AND LEASE LOSSES
SunTrust continuously monitors the quality of its loan portfolio and
maintains an ALLL sufficient to absorb probable losses inherent in
its total credit portfolio. The Company is committed to the early
recognition of problem loans and to an appropriate and adequate
level of allowance. At year-end 2004, the Company’s total
allowance was $1.1 billion, which represented 1.04% of period-end
loans. The year-end allowance included approximately $171.4 mil-
lion associated with the NCF portfolio acquired in October 2004.