MetLife 2003 Annual Report Download - page 92
Download and view the complete annual report
Please find page 92 of the 2003 MetLife annual report below. You can navigate through the pages in the report by either clicking on the pages listed below, or by using the keyword search tool below to find specific information within the annual report.-
 1
1 -
2
-
3
-
4
-
5
-
6
-
7
-
8
-
9
-
10
-
11
-
12
-
13
-
14
-
15
-
16
-
17
-
18
-
19
-
20
-
21
-
22
-
23
-
24
-
25
-
26
-
27
-
28
-
29
-
30
-
31
-
32
-
33
-
34
-
35
-
36
-
37
-
38
-
39
-
40
-
41
-
42
-
43
-
44
-
45
-
46
-
47
-
48
-
49
-
50
-
51
-
52
-
53
-
54
-
55
-
56
-
57
-
58
-
59
-
60
-
61
-
62
-
63
-
64
-
65
-
66
-
67
-
68
-
69
-
70
-
71
-
72
-
73
-
74
-
75
-
76
-
77
-
78
-
79
-
80
-
81
-
 82
82 -
 83
83 -
 84
84 -
 85
85 -
 86
86 -
 87
87 -
 88
88 -
 89
89 -
 90
90 -
 91
91 -
 92
92 -
 93
93 -
 94
94 -
 95
95 -
 96
96 -
 97
97
 |
 |

METLIFE, INC.
NOTES TO CONSOLIDATED FINANCIAL STATEMENTS — (Continued)
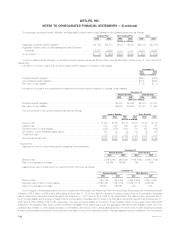
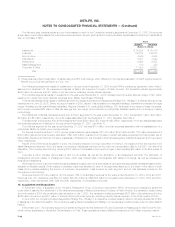
Auto & Asset Corporate
At or for the Year Ended December 31, 2001 Institutional Individual Home International Reinsurance Management & Other Total
(Dollars in millions)
Premiums ********************************************** $7,288 $4,563 $2,755 $846 $1,762 $ — $ (2) $17,212
Universal life and investment-type product policy fees ********* 592 1,260 — 38 — — (1) 1,889
Net investment income *********************************** 3,967 6,165 200 267 390 71 127 11,187
Other revenues ***************************************** 649 495 22 16 42 198 85 1,507
Net investment gains (losses)****************************** (16) 853 (17) (16) (6) 25 (1,402) (579)
Policyholder benefits and claims *************************** 8,924 5,233 2,121 689 1,484 — 3 18,454
Interest credited to policyholder account balances ************ 1,013 1,898 — 51 122 — — 3,084
Policyholder dividends************************************ 259 1,767 — 36 24 — — 2,086
Other expenses ***************************************** 1,746 2,747 800 329 491 252 657 7,022
Income (loss) from continuing operations before provision
(benefit) for income taxes ******************************* 538 1,691 39 46 67 42 (1,853) 570
Income from discontinued operations, net of income taxes ***** 21 36 — — — — 50 107
Net income (loss) *************************************** 382 1,095 41 14 40 27 (1,126) 473
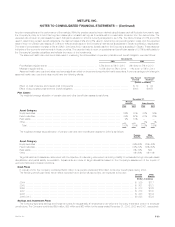
The following table indicates amounts in the current and prior years that have been classified as discontinued operations in accordance with
SFAS 144:
Year ended December 31,
2003 2002 2001
(Dollars in millions)
Net investment income
Institutional ************************************************************************************* $2 $33 $34
Individual*************************************************************************************** 55056
Corporate & Other******************************************************************************* 45 77 79
Total net investment income********************************************************************* $ 52 $160 $169
Net investment gains (losses)
Institutional ************************************************************************************* $ 45 $156 $ —
Individual*************************************************************************************** 43 262 —
Corporate & Other******************************************************************************* 333 164 —
Total net investment gains (losses) *************************************************************** $421 $582 $ —
Interest Expense
Individual*************************************************************************************** $1 $1 $—
Total interest expense ************************************************************************** $1 $1 $—
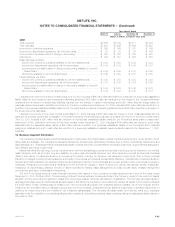
Economic Capital. Beginning in 2003, the Company changed its methodology of allocating capital to its business segments from Risk-Based
Capital (‘‘RBC’’) to Economic Capital. Prior to 2003, the Company’s business segments’ allocated equity was primarily based on RBC, an internally
developed formula based on applying a multiple to the National Association of Insurance Commissioners Statutory Risk-Based Capital and included
certain adjustments in accordance with accounting principles generally accepted in the United States of America (‘‘GAAP’’). Economic Capital is an
internally developed risk capital model, the purpose of which is to measure the risk in the business and to provide a basis upon which capital is deployed.
The Economic Capital model accounts for the unique and specific nature of the risks inherent in MetLife’s businesses. This is in contrast to the
standardized regulatory RBC formula, which is not as refined in its risk calculations with respect to the nuances of the Company’s businesses.
The change in methodology is being applied prospectively. This change has and will continue to impact the level of net investment income and net
income of each of the Company’s business segments. A portion of net investment income is credited to the segments based on the level of allocated
equity. This change in methodology of allocating equity does not impact the Company’s consolidated net investment income or net income.
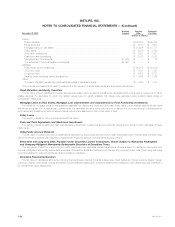
The following table presents actual and pro forma net investment income with respect to the Company’s segments for the years ended
December 31, 2002 and 2001. The amounts shown as pro forma reflect net investment income that would have been reported in these years had the
Company allocated capital based on Economic Capital rather than on the basis of RBC.
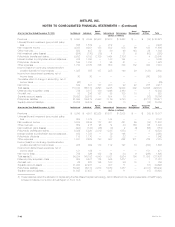
Net Investment Income
For the Years Ended December 31,
2002 2001
Actual Pro forma Actual Pro forma
(Dollars in millions)
Institutional****************************************************************** $ 3,918 $ 3,980 $ 3,967 $ 4,040
Individual ******************************************************************* 6,244 6,155 6,165 6,078
Auto & Home *************************************************************** 177 160 200 184
International ***************************************************************** 461 424 267 251
Reinsurance **************************************************************** 421 382 390 354
Asset Management ********************************************************** 59 71 71 89
Corporate & Other *********************************************************** (19) 89 127 191
Total *************************************************************** $11,261 $11,261 $11,187 $11,187
MetLife, Inc. F-47