MetLife 2003 Annual Report Download - page 74
Download and view the complete annual report
Please find page 74 of the 2003 MetLife annual report below. You can navigate through the pages in the report by either clicking on the pages listed below, or by using the keyword search tool below to find specific information within the annual report.-
 1
1 -
2
-
3
-
4
-
5
-
6
-
7
-
8
-
9
-
10
-
11
-
12
-
13
-
14
-
15
-
16
-
17
-
18
-
19
-
20
-
21
-
22
-
23
-
24
-
25
-
26
-
27
-
28
-
29
-
30
-
31
-
32
-
33
-
34
-
35
-
36
-
37
-
38
-
39
-
40
-
41
-
42
-
43
-
44
-
45
-
46
-
47
-
48
-
49
-
50
-
51
-
52
-
53
-
54
-
55
-
56
-
57
-
58
-
59
-
60
-
61
-
62
-
63
-
 64
64 -
 65
65 -
 66
66 -
 67
67 -
 68
68 -
 69
69 -
 70
70 -
 71
71 -
 72
72 -
 73
73 -
 74
74 -
 75
75 -
 76
76 -
 77
77 -
 78
78 -
 79
79 -
 80
80 -
 81
81 -
 82
82 -
 83
83 -
 84
84 -
85
-
86
-
87
-
88
-
89
-
90
-
91
-
92
-
93
-
94
-
95
-
96
-
97
 |
 |

METLIFE, INC.
NOTES TO CONSOLIDATED FINANCIAL STATEMENTS — (Continued)
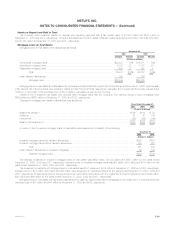
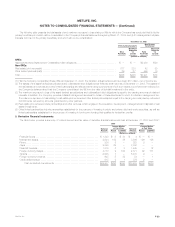
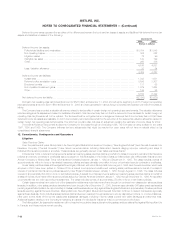
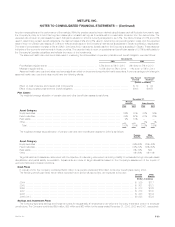
Closed block revenues and expenses were as follows:
Years Ended December 31,
2003 2002 2001
(Dollars in millions)
REVENUES
Premiums *********************************************************************************** $3,365 $3,551 $3,658
Net investment income and other revenues******************************************************* 2,554 2,568 2,547
Net investment gains (losses) (net of amounts allocated from the policyholder dividend obligation of ($144),
($157) and ($159), respectively) ************************************************************** 16 168 (12)
Total revenues *********************************************************************** 5,935 6,287 6,193
EXPENSES
Policyholder benefits and claims **************************************************************** 3,660 3,770 3,862
Policyholder dividends************************************************************************* 1,509 1,573 1,544
Change in policyholder dividend obligation (excludes amounts directly related to net investment gains
(losses) of ($144), ($157) and ($159), respectively) ********************************************** 144 157 159
Other expenses ****************************************************************************** 297 310 352
Total expenses*********************************************************************** 5,610 5,810 5,917
Revenues net of expenses before income taxes*************************************************** 325 477 276
Income taxes ******************************************************************************** 118 173 97
Revenues net of expenses and income taxes ***************************************************** $ 207 $ 304 $ 179
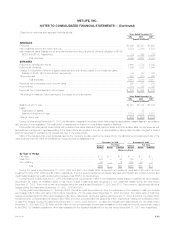
The change in maximum future earnings of the closed block is as follows:
Years Ended December 31,
2003 2002 2001
(Dollars in millions)
Balance at end of year ************************************************************************ $4,907 $5,114 $5,333
Less:
Reallocation of assets*********************************************************************** —85—
Balance at beginning of year ***************************************************************** 5,114 5,333 5,512
Change during year*************************************************************************** $ (207) $ (304) $ (179)
During the year ended December 31, 2002, the allocation of assets to the closed block was revised to appropriately classify assets in accordance
with the plan of demutualization. The reallocation of assets had no impact on consolidated assets or liabilities.
Metropolitan Life charges the closed block with federal income taxes, state and local premium taxes, and other additive state or local taxes, as well
as investment management expenses relating to the closed block as provided in the plan of demutualization. Metropolitan Life also charges the closed
block for expenses of maintaining the policies included in the closed block.
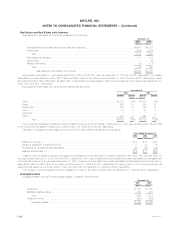
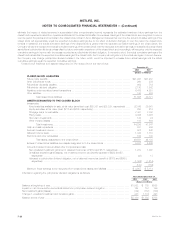
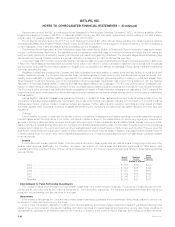
Many of the derivative instrument strategies used by the Company are also used for the closed block. The table below provides a summary of the
notional amount and fair value of derivatives by hedge accounting classification at:
December 31, 2003 December 31, 2002
Fair Value Fair Value
Notional Notional
Amount Assets Liabilities Amount Assets Liabilities
(Dollar in millions)
By Type of Hedge
Fair value ********************************************************* $ 6 $ — $ 1 $ — $— $—
Cash flow ******************************************************** 473 — 80 128 2 11
Non qualifying ***************************************************** 90 — 12 258 32 2
Total ***************************************************** $569 $ — $93 $386 $34 $13
During the years ended December 31, 2003, 2002 and 2001, the closed block recognized net investment expenses of $2 million and net
investment income of $1 million and $1 million, respectively, from the periodic settlement of interest rate caps and interest rate, foreign currency and
credit default swaps that qualify as accounting hedges under SFAS 133, as amended.
During the year ended December 31, 2003, the closed block recognized $1 million in net investment losses related to qualifying fair value hedges.
Accordingly, $1 million of unrealized gains on fair value hedged investments was recognized in net investment losses during the year ended
December 31, 2003. There were no fair value hedges during the years ended December 31, 2002 and 2001. There were no discontinued fair value
hedges during the years ended December 31, 2003, 2002 and 2001.
For the years ended December 31, 2003 and 2002, the net amounts accumulated in other comprehensive income relating to cash flow hedges
were losses of $75 million and gains of $21 million, respectively. For the years ended December 31, 2003 and 2002, the market value of cash flow
hedges decreased by $106 million and increased by $4 million, respectively. During the years ended December 31, 2003 and 2002, the closed block
recognized other comprehensive net losses of $93 million and other comprehensive net gains of $4 million, respectively, relating to the effective portion
of cash flow hedges. During the years ended December 31, 2003, 2002 and 2001, no cash flow hedges were discontinued. For the years ended
December 31, 2003 and 2002, $3 million and $4 million of other comprehensive income was reclassified to net investment income, respectively, related
to the SFAS 133 transition adjustment. Amounts reclassified for the transition adjustment for the year ended December 31, 2001 were insignificant.
MetLife, Inc. F-29