MetLife 2003 Annual Report Download - page 69
Download and view the complete annual report
Please find page 69 of the 2003 MetLife annual report below. You can navigate through the pages in the report by either clicking on the pages listed below, or by using the keyword search tool below to find specific information within the annual report.-
 1
1 -
2
-
3
-
4
-
5
-
6
-
7
-
8
-
9
-
10
-
11
-
12
-
13
-
14
-
15
-
16
-
17
-
18
-
19
-
20
-
21
-
22
-
23
-
24
-
25
-
26
-
27
-
28
-
29
-
30
-
31
-
32
-
33
-
34
-
35
-
36
-
37
-
38
-
39
-
40
-
41
-
42
-
43
-
44
-
45
-
46
-
47
-
48
-
49
-
50
-
51
-
52
-
53
-
54
-
55
-
56
-
57
-
58
-
 59
59 -
 60
60 -
 61
61 -
 62
62 -
 63
63 -
 64
64 -
 65
65 -
 66
66 -
 67
67 -
 68
68 -
 69
69 -
 70
70 -
 71
71 -
 72
72 -
 73
73 -
 74
74 -
 75
75 -
 76
76 -
 77
77 -
 78
78 -
 79
79 -
80
-
81
-
82
-
83
-
84
-
85
-
86
-
87
-
88
-
89
-
90
-
91
-
92
-
93
-
94
-
95
-
96
-
97
 |
 |

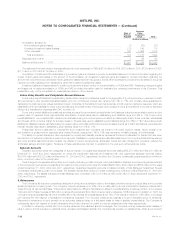
METLIFE, INC.
NOTES TO CONSOLIDATED FINANCIAL STATEMENTS — (Continued)
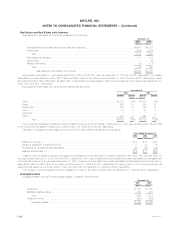
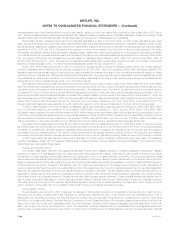
The following is a reconciliation of the notional amounts by derivative type and strategy at December 31, 2003 and 2002:
December 31, 2002 Terminations/ December 31, 2003
Notional Amount Additions Maturities Notional Amount
(Dollars in millions)
BY DERIVATIVE TYPE
Financial futures *************************************************** $ 4 $ 2,208 $ 864 $ 1,348
Interest rate swaps************************************************* 3,866 8,063 1,985 9,944
Floors************************************************************ 325 — — 325
Caps ************************************************************ 8,040 3,000 1,695 9,345
Financial forwards************************************************** 1,945 1,310 1,945 1,310
Foreign currency swaps ******************************************** 2,371 2,534 195 4,710
Options ********************************************************** 6,472 — 407 6,065
Foreign currency forwards******************************************* 54 663 22 695
Written covered calls *********************************************** — 1,178 1,178 —
Credit default swaps *********************************************** 376 284 45 615
Total contractual commitments *********************************** $23,453 $19,240 $8,336 $34,357
BY DERIVATIVE STRATEGY
Liability hedging *************************************************** $ 8,954 $ 5,386 $1,952 $12,388
Invested asset hedging ********************************************* 5,411 7,295 1,823 10,883
Portfolio hedging*************************************************** 9,028 2,443 4,539 6,932
Firm commitments and forecasted transactions ************************* 60 3,589 22 3,627
Hedging net investments in foreign operations ************************** — 527 — 527
Total contractual commitments *********************************** $23,453 $19,240 $8,336 $34,357
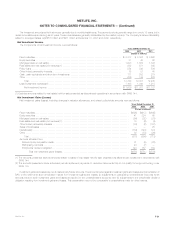
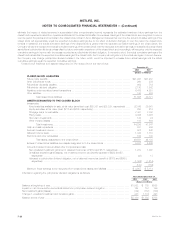
The following table presents the notional amounts of derivative financial instruments by maturity at December 31, 2003:
Remaining Life
After One After Five
One Year Year Through Years Through After Ten
or Less Five Years Ten Years Years Total
(Dollars in millions)
Financial futures **************************************************** $ 1,348 $ — $ — $ — $ 1,348
Interest rate swaps ************************************************** 242 6,343 1,693 1,666 9,944
Floors ************************************************************* — — 325 — 325
Caps ************************************************************* 3,150 6,195 — — 9,345
Financial forwards *************************************************** 1,310 — — — 1,310
Foreign currency swaps********************************************** 327 1,676 2,271 436 4,710
Options *********************************************************** 4,163 1,901 — 1 6,065
Foreign currency forwards ******************************************** 695 — — — 695
Written covered calls ************************************************ —— — ——
Credit default swaps************************************************* 189 426 — — 615
Total contractual commitments ************************************ $11,424 $16,541 $4,289 $2,103 $34,357
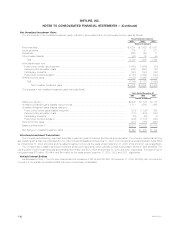
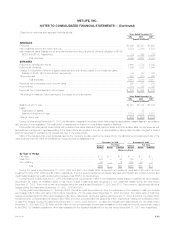
The following table presents the notional amounts and fair values of derivatives by type of hedge designation at December 31, 2003 and 2002:
2003 2002
Fair Value Fair Value
Notional Notional
Amount Assets Liabilities Amount Assets Liabilities
(Dollars in millions)
BY TYPE OF HEDGE
Fair value ************************************************************ $ 4,027 $ 27 $297 $ 420 $ — $ 64
Cash flow *********************************************************** 13,173 59 449 3,520 69 73
Foreign operations 527 — 10 — — —
Non qualifying ******************************************************** 16,630 170 142 19,513 239 183
Total ******************************************************** $34,357 $256 $898 $23,453 $308 $320
The Company recognized net investment expense of $63 million and net investment income of $9 million and $9 million, from the periodic
settlement of interest rate caps and interest rate, foreign currency and credit default swaps that qualify as accounting hedges under SFAS No. 133, as
amended, for the years ended December 31, 2003, 2002 and 2001, respectively.
During the years ended December 31, 2003 and 2002, the Company recognized $191 million and $30 million, respectively, in net investment
losses related to qualifying fair value hedging instruments. Accordingly, $159 million and $34 million of net unrealized gains on fair value hedged
investments were recognized in net investment gains and losses during the years ended December 31, 2003 and 2002, respectively. There were no
MetLife, Inc.
F-24