MetLife 2003 Annual Report Download - page 66
Download and view the complete annual report
Please find page 66 of the 2003 MetLife annual report below. You can navigate through the pages in the report by either clicking on the pages listed below, or by using the keyword search tool below to find specific information within the annual report.-
 1
1 -
2
-
3
-
4
-
5
-
6
-
7
-
8
-
9
-
10
-
11
-
12
-
13
-
14
-
15
-
16
-
17
-
18
-
19
-
20
-
21
-
22
-
23
-
24
-
25
-
26
-
27
-
28
-
29
-
30
-
31
-
32
-
33
-
34
-
35
-
36
-
37
-
38
-
39
-
40
-
41
-
42
-
43
-
44
-
45
-
46
-
47
-
48
-
49
-
50
-
51
-
52
-
53
-
54
-
55
-
 56
56 -
 57
57 -
 58
58 -
 59
59 -
 60
60 -
 61
61 -
 62
62 -
 63
63 -
 64
64 -
 65
65 -
 66
66 -
 67
67 -
 68
68 -
 69
69 -
 70
70 -
 71
71 -
 72
72 -
 73
73 -
 74
74 -
 75
75 -
 76
76 -
77
-
78
-
79
-
80
-
81
-
82
-
83
-
84
-
85
-
86
-
87
-
88
-
89
-
90
-
91
-
92
-
93
-
94
-
95
-
96
-
97
 |
 |

METLIFE, INC.
NOTES TO CONSOLIDATED FINANCIAL STATEMENTS — (Continued)
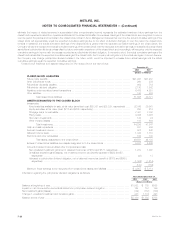
The investment amounts set forth above are generally due in monthly installments. The payment periods generally range from one to 15 years, but in
certain circumstances are as long as 30 years. These receivables are generally collateralized by the related property. The Company’s deferred tax liability
related to leveraged leases was $870 million and $981 million at December 31, 2003 and 2002, respectively.
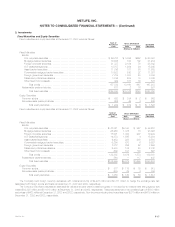
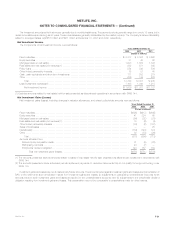
Net Investment Income
The components of net investment income were as follows:
Years Ended December 31,
2003 2002 2001
(Dollars in millions)
Fixed maturities *************************************************************************** $ 8,817 $ 8,367 $ 8,562
Equity securities ************************************************************************** 31 43 62
Mortgage loans on real estate*************************************************************** 1,903 1,883 1,848
Real estate and real estate joint ventures(1) *************************************************** 982 971 845
Policy loans ****************************************************************************** 554 543 536
Other limited partnership interests************************************************************ 75 57 48
Cash, cash equivalents and short-term investments ******************************************** 171 252 279
Other *********************************************************************************** 206 185 225
Total ******************************************************************************** 12,739 12,301 12,405
Less: Investment expenses(1) *************************************************************** 1,103 1,040 1,218
Net investment income **************************************************************** $11,636 $11,261 $11,187
(1) Excludes amounts related to real estate held-for-sale presented as discontinued operations in accordance with SFAS 144.
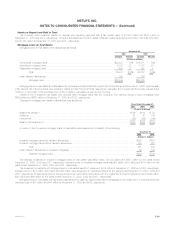
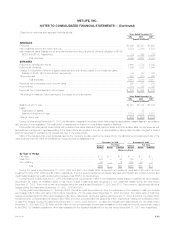
Net Investment Gains (Losses)
Net investment gains (losses), including changes in valuation allowances, and related policyholder amounts were as follows:
Years Ended December 31,
2003 2002 2001
(Dollars in millions)
Fixed maturities********************************************************************************** $(398) $(917) $(645)
Equity securities ********************************************************************************* 41 224 65
Mortgage loans on real estate ********************************************************************* (56) (22) (91)
Real estate and real estate joint ventures(1) ********************************************************** 19 (6) (4)
Other limited partnership interests ****************************************************************** (84) (2) (161)
Sales of businesses****************************************************************************** ——25
Derivatives(2)************************************************************************************ (134) (140) 124
Other ****************************************************************************************** 39 (33) (26)
Total *************************************************************************************** (573) (896) (713)
Amounts allocated from:
Deferred policy acquisition costs ***************************************************************** 31 (5) (25)
Participating contracts ************************************************************************** 40 (7) —
Policyholder dividend obligation ****************************************************************** 144 157 159
Total net investment gains (losses) ********************************************************** $(358) $(751) $(579)
(1) The amounts presented exclude amounts related to sales of real estate held-for-sale presented as discontinued operations in accordance with
SFAS 144.
(2) The amounts presented include scheduled periodic settlement payments on derivative instruments that do not qualify for hedge accounting under
SFAS 133.
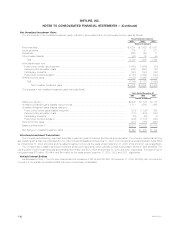
Investment gains and losses are net of related policyholder amounts. The amounts netted against investment gains and losses are (i) amortization of
DAC to the extent that such amortization results from investment gains and losses; (ii) adjustments to participating contractholder accounts when
amounts equal to such investment gains and losses are applied to the contractholder’s accounts; and (iii) adjustments to the policyholder dividend
obligation resulting from investment gains and losses. This presentation may not be comparable to presentations made by other insurers.
MetLife, Inc. F-21