MetLife 2003 Annual Report Download - page 13
Download and view the complete annual report
Please find page 13 of the 2003 MetLife annual report below. You can navigate through the pages in the report by either clicking on the pages listed below, or by using the keyword search tool below to find specific information within the annual report.-
 1
1 -
2
-
 3
3 -
 4
4 -
 5
5 -
 6
6 -
 7
7 -
 8
8 -
 9
9 -
 10
10 -
 11
11 -
 12
12 -
 13
13 -
 14
14 -
 15
15 -
 16
16 -
 17
17 -
 18
18 -
 19
19 -
 20
20 -
 21
21 -
 22
22 -
 23
23 -
24
-
25
-
26
-
27
-
28
-
29
-
30
-
31
-
32
-
33
-
34
-
35
-
36
-
37
-
38
-
39
-
40
-
41
-
42
-
43
-
44
-
45
-
46
-
47
-
48
-
49
-
50
-
51
-
52
-
53
-
54
-
55
-
56
-
57
-
58
-
59
-
60
-
61
-
62
-
63
-
64
-
65
-
66
-
67
-
68
-
69
-
70
-
71
-
72
-
73
-
74
-
75
-
76
-
77
-
78
-
79
-
80
-
81
-
82
-
83
-
84
-
85
-
86
-
87
-
88
-
89
-
90
-
91
-
92
-
93
-
94
-
95
-
96
-
97
 |
 |

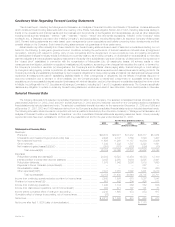
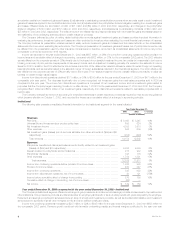
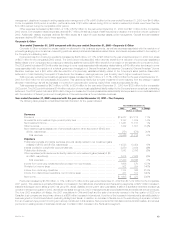
legal-related costs and an adjustment related to certain improperly deferred expenses at New England Financial. Although revenues are essentially flat
year over year, policy fees from variable life and annuity and investment-type products grew 15% year over year. In addition, there is a slight increase in
premiums related to other traditional life products. These increases are offset by a 5% decline in premiums from the Company’s closed block business,
which consists of participating policies issued prior to the Company’s demutualization. Premiums on the closed block represent approximately 80% of
this segment’s premiums for the year ended December 31, 2003.
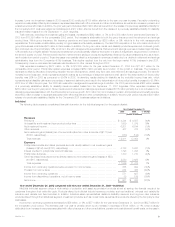
Total revenues, excluding net investment gains and losses, decreased by $7 million, or less than 1%, to $12,541 million for the year ended
December 31, 2003 from $12,548 million for the comparable 2002 period. Policy fees from variable life and annuity and investment-type products grew
by 15% over the prior year period. This growth is primarily a result of an 18% increase in the average separate account balances, which is largely
attributable to improvements in the U.S. financial markets. Additionally, this increase is associated with the aging of the in-force policies, as well as an
increase in the sales of the enterprise variable annuity product through non-traditional distribution channels. Policy fees from variable life and annuity and
investment-type products are typically calculated as a percentage of average assets. The value of these assets can fluctuate depending on equity market
performance. This increase in policy fee income was almost entirely offset by declines in premiums and net investment income. Premiums associated
with the Company’s closed block of business declined by $186 million, or 5%, which is in line with management’s expectations, as this business
continues to run-off. Partially offsetting this decline is a slight increase in the other traditional life products. The decline in net investment income is mainly
due to the change in capital allocation methodology and lower investment yields year over year.
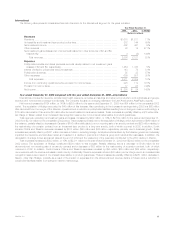
Total expenses increased by $144 million, or 1%, to $11,556 million for the year ended December 31, 2003 from $11,412 million for the
comparable 2002 period. Other expenses increased by $251 million over the prior year period primarily as a result of expenses associated with certain
efficiency initiatives and events. The most significant items include an increase of $67 million from pension and postretirement benefit expense, a
$48 million expense recorded in the second quarter of 2003 for an adjustment related to certain improperly deferred expenses at New England Financial,
$42 million in expenses associated with office closures and other consolidations, $42 million increase in legal-related costs, and other expenses
associated with strategic initiatives at New England Financial. Offsetting these expense increases are a decline in policyholder benefits consistent with the
aforementioned decline in the closed block and a decrease in dividends due to the reduction of the dividend scale in the fourth quarter of 2002, reflecting
the impact of the low U.S. interest rate environment on the asset portfolios supporting these policies.
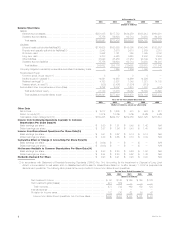
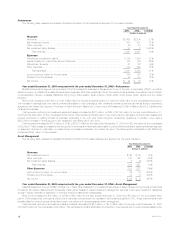
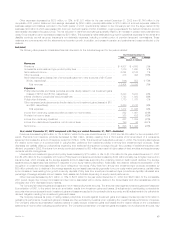
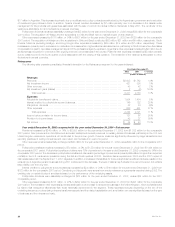
Auto & Home
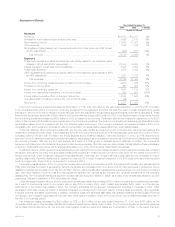
The following table presents consolidated financial information for the Auto & Home segment for the years indicated:
Year Ended December 31,
2003 2002 % Change
(Dollars in millions)
Revenues
Premiums ************************************************************************ $2,908 $2,828 3 %
Net investment income ************************************************************* 158 177 (11)%
Other revenues ******************************************************************** 32 26 23 %
Net investment gains (losses) ******************************************************** (15) (46) (67)%
Total revenues***************************************************************** 3,083 2,985 3 %
Expenses
Policyholder benefits and claims****************************************************** 2,139 2,019 6 %
Policyholder dividends ************************************************************** 1—0%
Other expenses ******************************************************************* 756 793 (5)%
Total expenses **************************************************************** 2,896 2,812 3 %
Income before provision for income taxes ********************************************** 187 173 8 %
Provision for income taxes*********************************************************** 30 41 (27)%
Net income *********************************************************************** $ 157 $ 132 19 %
Year ended December 31, 2003 compared with the year ended December 31, 2002—Auto & Home
Auto & Home, operating through Metropolitan Property and Casualty Insurance Company and its subsidiaries, offers personal lines property and
casualty insurance directly to employees through employer-sponsored programs, as well as through a variety of retail distribution channels. Auto & Home
primarily sells auto and homeowners insurance.
Net income increased by $25 million, or 19%, to $157 million for the year ended December 31, 2003 from $132 million for the comparable 2002
period. The increase in earnings year over year is mainly due to premium growth, lower investment losses and a reduction in expenses, partially offset by
adverse claims development.
Total revenues, excluding net investment gains and losses, increased by $67 million, or 2%, to $3,098 million for the year ended December 31,
2003 from $3,031 million for the comparable 2002 period. This variance is mainly due to increases in the average earned premium due to rate increases,
partially offset by lower investment income primarily resulting from the change in capital allocation methodology.
Total expenses increased by $84 million, or 3%, to $2,896 million for the year ended December 31, 2003 from $2,812 million for the comparable
2002 period. Adverse claims development related to prior accident years, resulting mostly from bodily injury and uninsured motorists claims, accounted
for $46 million of the increase in policyholder benefits. Also contributing to this increase are higher catastrophe losses of $22 million. Partially offsetting
these increases are improved non-catastrophe homeowners claims frequencies, a reduction in the number of auto and homeowners policies in-force,
and underwriting and agency management actions. In addition, there was a $23 million reduction in expenses resulting from the completion of the
St. Paul integration and a $35 million reduction in the cost associated with the New York assigned risk plan. The combined ratio, excluding catastrophes,
which represents losses and total expenses including claims as a percentage of premiums, declined to 97.1% for the year ended December 31, 2003
versus 97.4% for the comparable 2002 period.
MetLife, Inc.
10