MetLife 2003 Annual Report Download - page 19
Download and view the complete annual report
Please find page 19 of the 2003 MetLife annual report below. You can navigate through the pages in the report by either clicking on the pages listed below, or by using the keyword search tool below to find specific information within the annual report.-
 1
1 -
2
-
3
-
4
-
5
-
6
-
7
-
8
-
 9
9 -
 10
10 -
 11
11 -
 12
12 -
 13
13 -
 14
14 -
 15
15 -
 16
16 -
 17
17 -
 18
18 -
 19
19 -
 20
20 -
 21
21 -
 22
22 -
 23
23 -
 24
24 -
 25
25 -
 26
26 -
 27
27 -
 28
28 -
 29
29 -
30
-
31
-
32
-
33
-
34
-
35
-
36
-
37
-
38
-
39
-
40
-
41
-
42
-
43
-
44
-
45
-
46
-
47
-
48
-
49
-
50
-
51
-
52
-
53
-
54
-
55
-
56
-
57
-
58
-
59
-
60
-
61
-
62
-
63
-
64
-
65
-
66
-
67
-
68
-
69
-
70
-
71
-
72
-
73
-
74
-
75
-
76
-
77
-
78
-
79
-
80
-
81
-
82
-
83
-
84
-
85
-
86
-
87
-
88
-
89
-
90
-
91
-
92
-
93
-
94
-
95
-
96
-
97
 |
 |

Korea, Taiwan, and the June 2002 acquisition of Hidalgo. An increase in Reinsurance of $55 million is due to growth in the business, commensurate with
the growth in premiums described above.
Income tax expense for the year ended December 31, 2002 was $502 million, or 31% of income from continuing operations before provision for
income taxes, compared with $204 million, or 36%, for the comparable 2001 period. The 2002 effective tax rate differs from the federal corporate tax rate
of 35% primarily due to the impact of non-taxable investment income. The 2001 effective tax rate differs from the federal corporate tax rate of 35%, due to
an increase in prior year income taxes on capital gains.
In accordance with SFAS No. 144, Accounting for the Impairment or Disposal of Long-Lived Assets (‘‘SFAS 144’’), income related to the Company’s
real estate which was identified as held-for-sale on or after January 1, 2002 is presented as discontinued operations for the years ended December 31,
2002 and 2001. The income from discontinued operations is comprised of net investment income and net investment gains related to 47 properties that
the Company began marketing for sale on or after January 1, 2002. For the year ended December 31, 2002, the Company recognized $582 million of
net investment gains from discontinued operations due primarily to the sale of 36 properties.
Institutional
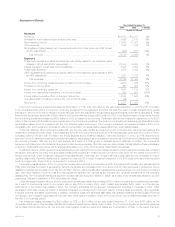
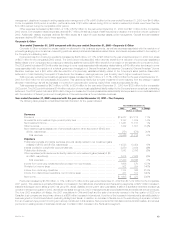
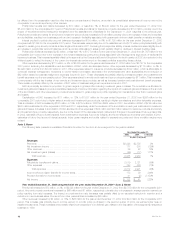
The following table presents consolidated financial information for the Institutional segment for the years indicated:
Year Ended December 31,
2002 2001 % Change
(Dollars in millions)
Revenues
Premiums *********************************************************************** $ 8,245 $7,288 13 %
Universal life and investment-type product policy fees*********************************** 624 592 5 %
Net investment income ************************************************************ 3,918 3,967 (1)%
Other revenues******************************************************************* 609 649 (6)%
Net investment gains (losses) (net of amounts allocable from other accounts of $6 and ($105),
respectively) ******************************************************************* (494) (16) 2,988 %
Total revenues**************************************************************** 12,902 12,480 3 %
Expenses
Policyholder benefits and claims (excludes amounts directly related to net investment gains
(losses) of $6 and ($105), respectively)********************************************* 9,339 8,924 5 %
Interest credited to policyholder account balances************************************** 932 1,013 (8)%
Policyholder dividends ************************************************************* 115 259 (56)%
Other expenses ****************************************************************** 1,531 1,746 (12)%
Total expenses *************************************************************** 11,917 11,942 (0)%
Income from continuing operations before provision for income taxes********************** 985 538 83 %
Provision for income taxes ********************************************************* 347 177 96 %
Income from continuing operations ************************************************** 638 361 77 %
Income from discontinued operations, net of income taxes ****************************** 121 21 476 %
Net income ********************************************************************** $ 759 $ 382 99 %
Year ended December 31, 2002 compared with the year ended December 31, 2001—Institutional
Premiums increased by $957 million, or 13%, to $8,245 million for the year ended December 31, 2002 from $7,288 million for the comparable
2001 period. Group insurance premiums increased by $496 million as a result of growth in this segment’s group life, dental, disability and long-term care
businesses. Retirement and savings premiums increased by $461 million primarily due to the sale of a significant contract in the second quarter of 2002,
as well as new sales throughout 2002 from structured settlements and traditional annuity products. Retirement and savings premium levels are
significantly influenced by large transactions and, as a result, can fluctuate from period to period.
Universal life and investment-type product policy fees increased by $32 million, or 5%, to $624 million for the year ended December 31, 2002 from
$592 million for the comparable 2001 period. This increase is primarily attributable to a fee resulting from the renegotiation of a portion of a bank-owned
life insurance contract, as well as growth in existing business in the group universal life product line.
Other revenues decreased by $40 million, or 6%, to $609 million for the year ended December 31, 2002 from $649 million for the comparable 2001
period. Retirement and savings other revenues decreased $73 million primarily due to a reduction in administrative fees as a result of the Company’s exit
from the large market 401(k) business in late 2001, and lower fees earned on investments in separate accounts resulting generally from poor equity
market performance. This decrease is partially offset by a $33 million increase in group insurance due to growth in the administrative service businesses
and a settlement received in 2002 related to the Company’s former medical business.
Policyholder benefits and claims increased by $415 million, or 5%, to $9,339 million for the year ended December 31, 2002 from $8,924 million for
the comparable 2001 period. This variance is attributable to increases of $238 million and $177 million in group insurance and retirement and savings,
respectively. Excluding $291 million of 2001 claims related to the September 11, 2001 tragedies, group insurance policyholder benefits and claims
increased by $529 million commensurate with the aforementioned premium growth in this segment’s group life, dental, disability, and long-term care
businesses. Excluding $215 million of 2001 policyholder benefits related to the fourth quarter 2001 business realignment initiatives, retirement and
savings policyholder benefits increased $392 million, commensurate with the aforementioned premium growth.
Interest credited to policyholders decreased by $81 million, or 8%, to $932 million for the year ended December 31, 2002 from $1,013 million for
the comparable 2001 period. Decreases of $42 million and $39 million in retirement and savings and group insurance, respectively, are primarily
attributable to declines in the average crediting rates in 2002 as a result of the current low interest rate environment.
Policyholder dividends decreased by $144 million, or 56%, to $115 million for the year ended December 31, 2002 from $259 million for the
comparable 2001 period. This decline is largely attributable to unfavorable mortality experience of several large group clients. Policyholder dividends vary
from period to period based on participating contract experience, which are generally recorded in policyholder benefits and claims.
MetLife, Inc.
16