MetLife 2003 Annual Report Download - page 63
Download and view the complete annual report
Please find page 63 of the 2003 MetLife annual report below. You can navigate through the pages in the report by either clicking on the pages listed below, or by using the keyword search tool below to find specific information within the annual report.-
 1
1 -
2
-
3
-
4
-
5
-
6
-
7
-
8
-
9
-
10
-
11
-
12
-
13
-
14
-
15
-
16
-
17
-
18
-
19
-
20
-
21
-
22
-
23
-
24
-
25
-
26
-
27
-
28
-
29
-
30
-
31
-
32
-
33
-
34
-
35
-
36
-
37
-
38
-
39
-
40
-
41
-
42
-
43
-
44
-
45
-
46
-
47
-
48
-
49
-
50
-
51
-
52
-
 53
53 -
 54
54 -
 55
55 -
 56
56 -
 57
57 -
 58
58 -
 59
59 -
 60
60 -
 61
61 -
 62
62 -
 63
63 -
 64
64 -
 65
65 -
 66
66 -
 67
67 -
 68
68 -
 69
69 -
 70
70 -
 71
71 -
 72
72 -
 73
73 -
74
-
75
-
76
-
77
-
78
-
79
-
80
-
81
-
82
-
83
-
84
-
85
-
86
-
87
-
88
-
89
-
90
-
91
-
92
-
93
-
94
-
95
-
96
-
97
 |
 |

METLIFE, INC.
NOTES TO CONSOLIDATED FINANCIAL STATEMENTS — (Continued)
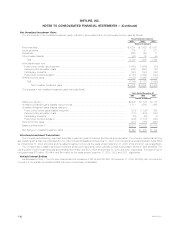
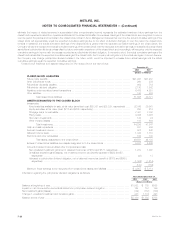
The cost or amortized cost and estimated fair value of bonds at December 31, 2003, by contractual maturity date (excluding scheduled sinking
funds), are shown below:
Cost or
Amortized Estimated
Cost Fair Value
(Dollars in millions)
Due in one year or less **************************************************************** $ 5,381 $ 5,542
Due after one year through five years ***************************************************** 30,893 32,431
Due after five years through ten years***************************************************** 29,342 31,830
Due after ten years ******************************************************************** 39,011 43,064
Subtotal ********************************************************************* 104,627 112,867
Mortgage-backed and other asset-backed securities **************************************** 53,095 54,348
Subtotal ********************************************************************* 157,722 167,215
Redeemable preferred stock ************************************************************ 611 537
Total fixed maturities *********************************************************** $158,333 $167,752
Bonds not due at a single maturity date have been included in the above table in the year of final maturity. Actual maturities may differ from
contractual maturities due to the exercise of prepayment options.
Sales of fixed maturities and equity securities classified as available-for-sale were as follows:
Years Ended December 31,
2002 2001 2000
(Dollars in millions)
Proceeds ******************************************************************************** $54,801 $37,427 $28,105
Gross investment gains ******************************************************************** $ 498 $ 1,661 $ 646
Gross investment losses ******************************************************************* $ (500) $ (979) $ (948)
Gross investment losses above exclude writedowns recorded during 2003, 2002 and 2001 for other-than-temporarily impaired available-for-sale
fixed maturities and equity securities of $355 million, $1,375 million and $278 million, respectively.
Excluding investments in U.S. Treasury securities and obligations of U.S. government corporations and agencies, the Company is not exposed to
any significant concentration of credit risk in its fixed maturities portfolio.
The following table shows the estimated fair values and gross unrealized losses of the Company’s fixed maturities, aggregated by sector and length
of time that the securities have been in a continuous unrealized loss position at December 31, 2003:
Equal to or Greater
Less than 12 Months than 12 Months Total
Gross Gross Gross
Estimated Unrealized Estimated Unrealized Estimated Unrealized
Fair Value Loss Fair Value Loss Fair Value Loss
(Dollars in millions)
U.S. corporate securities ***************** $ 7,214 $152 $1,056 $100 $ 8,270 $252
Mortgage-backed securities*************** 8,372 98 27 4 8,399 102
Foreign corporate securities*************** 2,583 65 355 14 2,938 79
U.S. treasuries/agencies ***************** 3,697 26 — — 3,697 26
Asset-backed securities ****************** 2,555 34 861 26 3,416 60
Commercial mortgage-backed securities **** 2,449 20 282 2 2,731 22
Foreign government securities************* 331 28 2 — 333 28
States and political subdivisions *********** 389 12 38 3 427 15
Other fixed income assets **************** 130 73 40 10 170 83
Total bonds ******************** 27,720 508 2,661 159 30,381 667
Redeemable preferred stocks ************* 222 62 278 14 500 76
Total fixed maturities ************* $27,942 $570 $2,939 $173 $30,881 $743
At December 31, 2003, the Company had gross unrealized losses of $6 million from equity securities that had been in an unrealized loss position for
less than twelve months. The amount of unrealized losses from equity securities that had been in an unrealized loss position for twelve months or greater
is less than $1 million at December 31, 2003. The fair value of those equity securities that had been in an unrealized loss position for less than twelve
months and for twelve months or greater at December 31, 2003, is $53 million and $22 million, respectively.
Securities Lending Program
The Company participates in a securities lending program whereby blocks of securities, which are included in investments, are loaned to third
parties, primarily major brokerage firms. The Company requires a minimum of 102% of the fair value of the loaned securities to be separately maintained
as collateral for the loans. Securities with a cost or amortized cost of $25,121 million and $16,196 million and an estimated fair value of $26,387 million
and $17,625 million were on loan under the program at December 31, 2003 and 2002, respectively. The Company was liable for cash collateral under
its control of $27,083 million and $17,862 million at December 31, 2003 and 2002, respectively. Security collateral on deposit from customers may not
be sold or repledged and is not reflected in the consolidated financial statements.
MetLife, Inc.
F-18