MetLife 2003 Annual Report Download - page 84
Download and view the complete annual report
Please find page 84 of the 2003 MetLife annual report below. You can navigate through the pages in the report by either clicking on the pages listed below, or by using the keyword search tool below to find specific information within the annual report.-
 1
1 -
2
-
3
-
4
-
5
-
6
-
7
-
8
-
9
-
10
-
11
-
12
-
13
-
14
-
15
-
16
-
17
-
18
-
19
-
20
-
21
-
22
-
23
-
24
-
25
-
26
-
27
-
28
-
29
-
30
-
31
-
32
-
33
-
34
-
35
-
36
-
37
-
38
-
39
-
40
-
41
-
42
-
43
-
44
-
45
-
46
-
47
-
48
-
49
-
50
-
51
-
52
-
53
-
54
-
55
-
56
-
57
-
58
-
59
-
60
-
61
-
62
-
63
-
64
-
65
-
66
-
67
-
68
-
69
-
70
-
71
-
72
-
73
-
 74
74 -
 75
75 -
 76
76 -
 77
77 -
 78
78 -
 79
79 -
 80
80 -
 81
81 -
 82
82 -
 83
83 -
 84
84 -
 85
85 -
 86
86 -
 87
87 -
 88
88 -
 89
89 -
 90
90 -
 91
91 -
 92
92 -
 93
93 -
 94
94 -
95
-
96
-
97
 |
 |

METLIFE, INC.
NOTES TO CONSOLIDATED FINANCIAL STATEMENTS — (Continued)
long-term expectations on the performance of the markets. While the precise expected return derived using this approach will fluctuate from year to year,
the Company’s policy is to hold this long-term assumption constant as long as it remains within a reasonable tolerance from the derived rate. The
expected rate of return on plan assets for use in that plan’s valuation in 2004 is currently anticipated to be 8.5%. The discount rates of 3.5% and 9.5%
used in determining pension benefit obligations, the discount rates of 4% and 9.5% used in determining net periodic pension costs, and the expected
rates of return on pension plan assets of 3.5% and 10% are attributable to the Company’s international subsidiaries in Taiwan and Mexico, respectively.
The rates of compensation increase of 3% and 2% in 2003 and 2002, respectively, is attributable to the Company’s subsidiary in Taiwan. These rates are
indicative of the economic environments in those countries. The expected rate of return on postretirement benefit plan assets of 3.79% is attributable to
the Company’s Canadian subsidiary and reflects the nature of the investments.
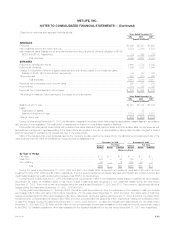
The assumed health care cost trend rates used in measuring the accumulated nonpension postretirement benefit obligation were as follows:
December 31,
2003 2002
Pre-Medicare eligible claims ******************************************* 8.5% down to 5% in 2010 9% down to 5% in 2010
Medicare eligible claims *********************************************** 10.5% down to 5% in 2014 11% down to 5% in 2014
Assumed health care cost trend rates may have a significant effect on the amounts reported for health care plans. A one-percentage point change in
assumed health care cost trend rates would have the following effects:
One Percent One Percent
Increase Decrease
(Dollars in millions)
Effect on total of service and interest cost components ************************************************ $ 10 $ (9)
Effect of accumulated postretirement benefit obligation************************************************* $108 $(105)
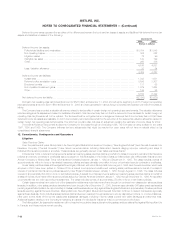
Plan Assets
The weighted average allocation of pension plan and other benefit plan assets is as follows:
December 31,
Pension
Benefits Other Benefits
2003 2002 2003 2002
Asset Category
Equity securities************************************************************************** 52% 38% 38% 36%
Fixed maturities ************************************************************************** 39% 52% 61% 63%
Real estate ****************************************************************************** 9% 10% — —
Other*********************************************************************************** — — 1% 1%
Total ********************************************************************************* 100% 100% 100% 100%
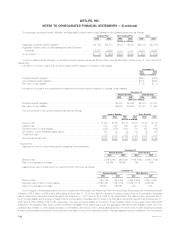
The weighted average target allocation of pension plan and other benefit plan assets for 2004 is as follows:
Pension Other
Benefits Benefits
Asset Category
Equity securities ********************************************************************************** 35%-60% 25%-40%
Fixed maturities *********************************************************************************** 35%-70% 50%-80%
Real estate*************************************************************************************** 0%-15% N/A
Other ******************************************************************************************* 0%-20% 0%-10%
Target allocations of assets are determined with the objective of maximizing returns and minimizing volatility of net assets through adequate asset
diversification and partial liability immunization. Adjustments are made to target allocations based on the Company’s assessment of the impact of
economic factors and market conditions.
Cash Flows
In January 2004, the Company contributed $450 million to its pension plans and $89 million to its other benefit plans during 2004.
The following benefit payments, which reflect expected future service as appropriate, are expected to be paid:
Pension Other
Benefits Benefits
(Dollars in millions)
2004 ********************************************************************************************** $ 329 $117
2005 ********************************************************************************************** $ 301 $121
2006 ********************************************************************************************** $ 313 $125
2007 ********************************************************************************************** $ 319 $130
2008 ********************************************************************************************** $ 328 $134
2009-2013 ***************************************************************************************** $1,828 $729
Savings and Investment Plans
The Company sponsors savings and investment plans for substantially all employees under which the Company matches a portion of employee
contributions. The Company contributed $59 million, $58 million and $60 million for the years ended December 31, 2003, 2002 and 2001, respectively.
MetLife, Inc. F-39