MetLife 2003 Annual Report Download - page 42
Download and view the complete annual report
Please find page 42 of the 2003 MetLife annual report below. You can navigate through the pages in the report by either clicking on the pages listed below, or by using the keyword search tool below to find specific information within the annual report.-
 1
1 -
2
-
3
-
4
-
5
-
6
-
7
-
8
-
9
-
10
-
11
-
12
-
13
-
14
-
15
-
16
-
17
-
18
-
19
-
20
-
21
-
22
-
23
-
24
-
25
-
26
-
27
-
28
-
29
-
30
-
31
-
 32
32 -
 33
33 -
 34
34 -
 35
35 -
 36
36 -
 37
37 -
 38
38 -
 39
39 -
 40
40 -
 41
41 -
 42
42 -
 43
43 -
 44
44 -
 45
45 -
 46
46 -
 47
47 -
 48
48 -
 49
49 -
 50
50 -
 51
51 -
 52
52 -
53
-
54
-
55
-
56
-
57
-
58
-
59
-
60
-
61
-
62
-
63
-
64
-
65
-
66
-
67
-
68
-
69
-
70
-
71
-
72
-
73
-
74
-
75
-
76
-
77
-
78
-
79
-
80
-
81
-
82
-
83
-
84
-
85
-
86
-
87
-
88
-
89
-
90
-
91
-
92
-
93
-
94
-
95
-
96
-
97
 |
 |

)potential for impairments of securities where the issuer, series of issuers or industry has suffered a catastrophic type of loss or has exhausted
natural resources; and
)other subjective factors, including concentrations and information obtained from regulators and rating agencies.
Equity securities or other limited partnership interests which are deemed to be other-than-temporarily impaired are written down to fair value. The
Company records writedowns as investment losses and adjusts the cost basis of the equity securities accordingly. The Company does not change the
revised cost basis for subsequent recoveries in value. Writedowns of equity securities and other limited partnership interests were $108 million and
$191 million years ended December 31, 2003 and 2002, respectively. During the years ended December 31, 2003 and 2002, the Company sold equity
securities with an estimated fair value of $62 million and $915 million, at a loss of $13 million and $85 million, respectively.
The gross unrealized loss related to the Company’s equity securities at December 31, 2003 was $6 million. Such securities are concentrated by
security type in common stock (36%) and preferred stock (63%); and are concentrated by industry in financial (57%) and domestic broad market mutual
funds (7%) (calculated as a percentage of gross unrealized loss).
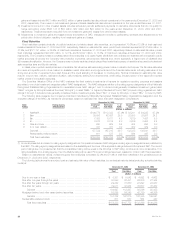
The following table presents the cost, gross unrealized losses and number of securities for equity securities where the estimated fair value had
declined and remained below cost by less than 20%, or 20% or more for:
December 31, 2003
Gross Unrealized Number of
Cost Losses Securities
Less than 20% or Less than 20% or Less than 20% or
20% more 20% more 20% more
(Dollars in millions)
Less than six months********************************************** $58 $1 $6 $— 19 1
Six months or greater but less than nine months *********************** —— — —— —
Nine months or greater but less than twelve months ******************** —— — —— 2
Twelve months or greater ****************************************** 22 — — — 14 —
Total **************************************************** $80 $1 $6 $ — 33 3
The Company’s review of its equity security exposure includes the analysis of total gross unrealized losses by three categories of securities:
(i) securities where the estimated fair value had declined and remained below cost by less than 20%; (ii) securities where the estimated fair value had
declined and remained below cost by 20% or more for less than six months; and (iii) securities where the estimated fair value had declined and remained
below cost by 20% or more for six months or greater. While all of these securities are monitored for potential impairment, the Company’s experience
indicates that the first two categories do not present as great a risk of impairment, and often, fair values recover over time as the factors that caused the
declines improve.
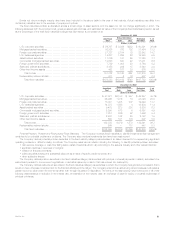
The following table presents the total gross unrealized losses for equity securities at December 31, 2003 where the estimated fair value had declined
and remained below cost by:
December 31, 2003
Gross Unrealized % of
Losses Total
(Dollars in millions)
Less than 20% ********************************************************************************** $6 $ 100%
20% or more for less than six months *************************************************************** ——
20% or more for six months or greater*************************************************************** ——
Total *********************************************************************************** $6 100.0%
The category of equity securities where the estimated fair value has declined and remained below cost by less than 20% is comprised of 33 equity
securities with a cost of $80 million and a gross unrealized loss of $6 million. These securities are concentrated by security type in common stock (33%)
and preferred stock (65%); and concentrated by industry in financial (59%) and communications (3%) (calculated as a percentage of gross unrealized
loss). The significant factors considered at December 31, 2003 in the review of equity securities for other-than-temporary impairment were as a result of
generally difficult economic and market conditions.
The Company did not hold any equity securities with a gross unrealized loss at December 31, 2003 greater than $5 million.
Other Invested Assets
The Company’s other invested assets consist principally of leveraged leases and funds withheld at interest of $3.9 billion and $3.1 billion at
December 31, 2003 and 2002, respectively. The leveraged leases are recorded net of non-recourse debt. The Company participates in lease
transactions, which are diversified by industry, asset type and geographic area. The Company regularly reviews residual values and writes down residuals
to expected values as needed. Funds withheld represent amounts contractually withheld by ceding companies in accordance with reinsurance
agreements. For agreements written on a modified coinsurance basis and certain agreements written on a coinsurance basis, assets supporting the
reinsured policies equal to the net statutory reserves are withheld and continue to be legally owned by the ceding company. Other invested assets also
include the fair value of embedded derivatives related to funds withheld and modified coinsurance contracts. Interest accrues to these funds withheld at
rates defined by the treaty terms and may be contractually specified or directly related to the investment portfolio. The Company’s other invested assets
represented 2.1% and 1.9% of cash and invested assets at December 31, 2003 and 2002, respectively.
Derivative Financial Instruments
The Company uses derivative instruments to manage risk through one of five principal risk management strategies: the hedging of (i) liabilities;
(ii) invested assets; (iii) portfolios of assets or liabilities; (iv) net investment in certain foreign operations; and (v) firm commitments and forecasted
transactions. Additionally, the Company enters into income generation and replication derivative transactions as permitted by its insurance subsidiaries’
Derivatives Use Plans approved by the applicable state insurance departments. The Company’s derivative hedging strategy employs a variety of
instruments, including financial futures, financial forwards, interest rate, credit default and foreign currency swaps, foreign currency forwards and options,
including caps and floors.
MetLife, Inc. 39