MetLife 2003 Annual Report Download - page 71
Download and view the complete annual report
Please find page 71 of the 2003 MetLife annual report below. You can navigate through the pages in the report by either clicking on the pages listed below, or by using the keyword search tool below to find specific information within the annual report.-
 1
1 -
2
-
3
-
4
-
5
-
6
-
7
-
8
-
9
-
10
-
11
-
12
-
13
-
14
-
15
-
16
-
17
-
18
-
19
-
20
-
21
-
22
-
23
-
24
-
25
-
26
-
27
-
28
-
29
-
30
-
31
-
32
-
33
-
34
-
35
-
36
-
37
-
38
-
39
-
40
-
41
-
42
-
43
-
44
-
45
-
46
-
47
-
48
-
49
-
50
-
51
-
52
-
53
-
54
-
55
-
56
-
57
-
58
-
59
-
60
-
 61
61 -
 62
62 -
 63
63 -
 64
64 -
 65
65 -
 66
66 -
 67
67 -
 68
68 -
 69
69 -
 70
70 -
 71
71 -
 72
72 -
 73
73 -
 74
74 -
 75
75 -
 76
76 -
 77
77 -
 78
78 -
 79
79 -
 80
80 -
 81
81 -
82
-
83
-
84
-
85
-
86
-
87
-
88
-
89
-
90
-
91
-
92
-
93
-
94
-
95
-
96
-
97
 |
 |

METLIFE, INC.
NOTES TO CONSOLIDATED FINANCIAL STATEMENTS — (Continued)
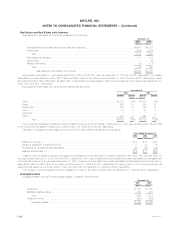
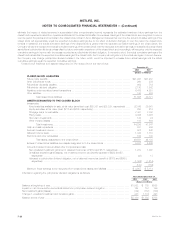
Deferred
Value of Policy
Business Acquisition
Acquired Costs Total
(Dollars in millions)
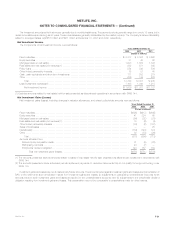
Amortization allocated to:
Net investment gains (losses) *********************************************************** (7) (24) (31)
Unrealized investment gains (losses)****************************************************** (31) 146 115
Other expenses *********************************************************************** 162 1,656 1,818
Total amortization ******************************************************************** 124 1,778 1,902
Dispositions and other ******************************************************************* 26668
Balance at December 31, 2003 *********************************************************** $1,657 $11,286 $12,943
The estimated future amortization expense allocated to other expenses for VOBA is $135 million in 2004, $128 million in 2005, $122 million in 2006,
$117 million in 2007 and $114 million in 2008.
Amortization of VOBA and DAC is allocated to (i) investment gains and losses to provide consolidated statement of income information regarding the
impact of such gains and losses on the amount of the amortization, (ii) unrealized investment gains and losses to provide information regarding the
amount that would have been amortized if such gains and losses had been recognized, and (iii) other expenses to provide amounts related to the gross
margins or profits originating from transactions other than investment gains and losses.
Investment gains and losses related to certain products have a direct impact on the amortization of VOBA and DAC. Presenting investment gains
and losses net of related amortization of VOBA and DAC provides information useful in evaluating the operating performance of the Company. This
presentation may not be comparable to presentations made by other insurers.
Future Policy Benefits and Policyholder Account Balances
Future policy benefit liabilities for participating traditional life insurance policies are equal to the aggregate of (i) net level premium reserves for death
and endowment policy benefits (calculated based upon the nonforfeiture interest rate, ranging from 3% to 11%, and mortality rates guaranteed in
calculating the cash surrender values described in such contracts), (ii) the liability for terminal dividends, and (iii) premium deficiency reserves, which are
established when the liabilities for future policy benefits plus the present value of expected future gross premiums are insufficient to provide for expected
future policy benefits and expenses after DAC is written off.
Future policy benefit liabilities for traditional annuities are equal to accumulated contractholder fund balances during the accumulation period and the
present value of expected future payments after annuitization. Interest rates used in establishing such liabilities range from 2% to 11%. Future policy
benefit liabilities for non-medical health insurance are calculated using the net level premium method and assumptions as to future morbidity, withdrawals
and interest, which provide a margin for adverse deviation. Interest rates used in establishing such liabilities range from 3% to 11%. Future policy benefit
liabilities for disabled lives are estimated using the present value of benefits method and experience assumptions as to claim terminations, expenses and
interest. Interest rates used in establishing such liabilities range from 3% to 11%.
Policyholder account balances for universal life and investment-type contracts are equal to the policy account values, which consist of an
accumulation of gross premium payments plus credited interest, ranging from 1% to 13%, less expenses, mortality charges, and withdrawals.
The liability for unpaid claims and claim expenses for property and casualty insurance represents the amount estimated for claims that have been
reported but not settled and claims incurred but not reported. Liabilities for unpaid claims are estimated based upon the Company’s historical experience
and other actuarial assumptions that consider the effects of current developments, anticipated trends and risk management programs, reduced for
anticipated salvage and subrogation. Revisions of these estimates are included in operations in the year such refinements are made.
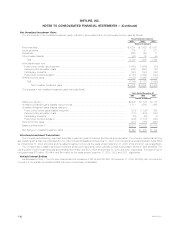
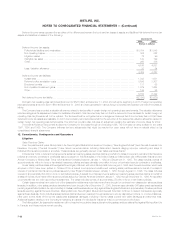
Separate Accounts
Separate accounts include two categories of account types: non-guaranteed separate accounts totaling $59,278 million and $44,470 million at
December 31, 2003 and 2002, respectively, for which the policyholder assumes the investment risk, and guaranteed separate accounts totaling
$16,478 million and $15,223 million at December 31, 2003 and 2002, respectively, for which the Company contractually guarantees either a minimum
return or account value to the policyholder.
Fees charged to the separate accounts by the Company (including mortality charges, policy administration fees and surrender charges) are reflected
in the Company’s revenues as universal life and investment-type product policy fees and totaled $626 million, $542 million and $559 million for the years
ended December 31, 2003, 2002 and 2001, respectively. Guaranteed separate accounts consisted primarily of Met Managed Guaranteed Interest
Contracts and participating close-out contracts. The average interest rates credited on these contracts were 4.5% and 4.8% at December 31, 2003 and
2002, respectively. The assets that support these liabilities were comprised of $13,513 million and $12,984 million in fixed maturities at December 31,
2003 and 2002, respectively.
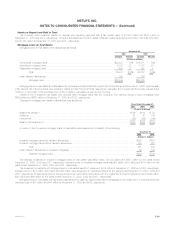
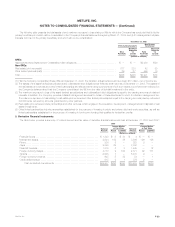
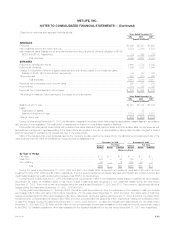
5. Reinsurance
The Company’s life insurance operations participate in reinsurance activities in order to limit losses, minimize exposure to large risks, and to provide
additional capacity for future growth. The Company currently reinsures up to 90% of the mortality risk for all new individual life insurance policies that it
writes through its various franchises. This practice was initiated by different franchises for different products starting at various points in time between
1992 and 2000. Risks in excess of $25 million on single life policies and $30 million on survivorship policies are 100% coinsured. In addition, in 1998, the
Company reinsured substantially all of the mortality risk on its universal life policies issued since 1983. RGA retains a maximum of $6 million of coverage
per individual life with respect to its assumed reinsurance business. The Company reinsures its business through a diversified group of reinsurers.
Placement of reinsurance is done primarily on an automatic basis and also on a facultative basis for risks of specific characteristics. The Company is
contingently liable with respect to ceded reinsurance should any reinsurer be unable to meet its obligations under these agreements.
In addition to reinsuring mortality risk, the Company reinsures other risks and specific coverages. The Company routinely reinsures certain classes of
risks in order to limit its exposure to particular travel, avocation and lifestyle hazards. The Company has exposure to catastrophes, which are an inherent
MetLife, Inc.
F-26