MetLife 2003 Annual Report Download - page 6
Download and view the complete annual report
Please find page 6 of the 2003 MetLife annual report below. You can navigate through the pages in the report by either clicking on the pages listed below, or by using the keyword search tool below to find specific information within the annual report.-
 1
1 -
 2
2 -
 3
3 -
 4
4 -
 5
5 -
 6
6 -
 7
7 -
 8
8 -
 9
9 -
 10
10 -
 11
11 -
 12
12 -
 13
13 -
 14
14 -
 15
15 -
 16
16 -
 17
17 -
18
-
19
-
20
-
21
-
22
-
23
-
24
-
25
-
26
-
27
-
28
-
29
-
30
-
31
-
32
-
33
-
34
-
35
-
36
-
37
-
38
-
39
-
40
-
41
-
42
-
43
-
44
-
45
-
46
-
47
-
48
-
49
-
50
-
51
-
52
-
53
-
54
-
55
-
56
-
57
-
58
-
59
-
60
-
61
-
62
-
63
-
64
-
65
-
66
-
67
-
68
-
69
-
70
-
71
-
72
-
73
-
74
-
75
-
76
-
77
-
78
-
79
-
80
-
81
-
82
-
83
-
84
-
85
-
86
-
87
-
88
-
89
-
90
-
91
-
92
-
93
-
94
-
95
-
96
-
97
 |
 |

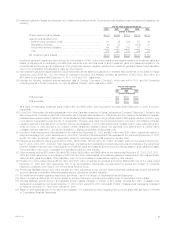
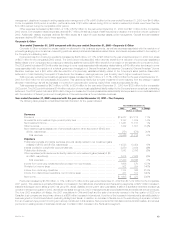
(2) Investment gains and losses are presented net of related policyholder amounts. The amounts netted against investment gains and losses are the
following:
For the Years Ended December 31,
2003 2002 2001 2000 1999
(Dollars in millions)
Gross investment gains (losses) ************************************ $(573) $(896) $(713) $(444) $(137)
Less amounts allocated from:
Deferred policy acquisition costs ********************************* 31 (5) (25) 95 46
Participating contracts ****************************************** 40 (7) — (126) 21
Policyholder dividend obligation*********************************** 144 157 159 85 —
Total ********************************************************* 215 145 134 54 67
Net investment gains (losses) ************************************** $(358) $(751) $(579) $(390) $ (70)
Investment gains and losses have been reduced by (i) amortization of DAC, to the extent that such amortization results from investment gains and
losses, (ii) adjustments to participating contractholder accounts when amounts equal to such investment gains and losses are applied to the
contractholder’s accounts, and (iii) adjustments to the policyholder dividend obligation resulting from investment gains and losses. This presentation
may not be comparable to presentations made by other insurers.
(3) Net investment gains and losses presented include scheduled periodic settlement payments on derivative instruments that do not qualify for hedge
accounting under SFAS No. 133, Accounting for Derivative Instruments and Hedging Activities, as amended, of $84 million, $32 million and
$24 million for the years ended December 31, 2003, 2002 and 2001, respectively.
(4) Includes the following combined financial statement data of Conning Corporation (‘‘Conning’’), which was sold in 2001 and the Company’s
controlling interest in Nvest Companies, L.P. and its affiliates (‘‘Nvest’’), which was sold in 2000:
For the Years Ended
December 31,
2001 2000 1999
(Dollars in millions)
Total revenues ************************************************************* $32 $605 $655
Total expenses************************************************************* $33 $580 $603
As a result of these sales, investment gains of $25 million and $663 million were recorded for the years ended December 31, 2001 and 2000,
respectively.
(5) In July 1998, Metropolitan Life sold a substantial portion of its Canadian operations to Clarica Life Insurance Company (‘‘Clarica Life’’). As part of that
sale, a large block of policies in effect with Metropolitan Life in Canada were transferred to Clarica Life, and the holders of the transferred Canadian
policies became policyholders of Clarica Life. Those transferred policyholders were no longer policyholders of Metropolitan Life and, therefore, were
not entitled to compensation under the plan of reorganization. However, as a result of a commitment made in connection with obtaining Canadian
regulatory approval of that sale and in connection with the demutualization, in 2000, Metropolitan Life’s Canadian branch made cash payments to
those who were, or were deemed to be, holders of these transferred Canadian policies. The payments were determined in a manner that is
consistent with the treatment of, and fair and equitable to, eligible policyholders of Metropolitan Life.
(6) Included in total revenues and total expenses for the year ended December 31, 2002 are $421 million and $358 million, respectively, related to
Aseguradora Hidalgo S.A., which was acquired in June 2002. Included in total revenues and total expenses for the year ended December 31, 2000
are $3,739 million and $3,561 million, respectively, related to GenAmerica, which was acquired in January 2000.
(7) Policyholder benefits and claims exclude ($184) million, ($150) million, ($159) million, $41 million, and ($21) million for the years ended Decem-
ber 31, 2003, 2002, 2001, 2000 and 1999, respectively, of adjustments to participating contractholder accounts and changes in the policyholder
dividend obligation that have been netted against net investment gains and losses as such amounts are directly related to such gains and losses.
This presentation may not be comparable to presentations made by other insurers.
(8) Other expenses exclude ($31) million, $5 million, $25 million, ($95) million, and ($46) million for the years ended December 31, 2003, 2002, 2001,
2000 and 1999 respectively, of amortization of DAC that have been netted against net investment gains and losses as such amounts are directly
related to such gains and losses. This presentation may not be comparable to presentations made by other insurers.
(9) Provision for income taxes includes ($145) million and $125 million for surplus tax (credited) accrued by Metropolitan Life for the years ended
December 31, 2000 and 1999, respectively. Prior to its demutualization, Metropolitan Life was subject to surplus tax imposed on mutual life
insurance companies under Section 809 of the Internal Revenue Code.
(10) Policyholder liabilities include future policy benefits and other policyholder funds. Life and health policyholder liabilities also include policyholder
account balances, policyholder dividends payable and the policyholder dividend obligation.
(11) For additional information regarding these items, see Notes 1 and 14 of Notes to Consolidated Financial Statements.
(12) Return on equity is defined as net income divided by average total equity, excluding accumulated other comprehensive income (loss).
(13) Includes MetLife’s general account and separate account assets managed on behalf of third parties. Includes $21 billion of assets under
management managed by Conning at December 31, 2000, which was sold in 2001. Includes $133 billion of assets under management managed
by Nvest at December 31, 1999 which was sold in 2000.
(14) Based on earnings subsequent to the date of demutualization. For additional information regarding net income per share data, see Note 16 of Notes
to Consolidated Financial Statements.
MetLife, Inc. 3