MetLife 2003 Annual Report Download - page 64
Download and view the complete annual report
Please find page 64 of the 2003 MetLife annual report below. You can navigate through the pages in the report by either clicking on the pages listed below, or by using the keyword search tool below to find specific information within the annual report.-
 1
1 -
2
-
3
-
4
-
5
-
6
-
7
-
8
-
9
-
10
-
11
-
12
-
13
-
14
-
15
-
16
-
17
-
18
-
19
-
20
-
21
-
22
-
23
-
24
-
25
-
26
-
27
-
28
-
29
-
30
-
31
-
32
-
33
-
34
-
35
-
36
-
37
-
38
-
39
-
40
-
41
-
42
-
43
-
44
-
45
-
46
-
47
-
48
-
49
-
50
-
51
-
52
-
53
-
 54
54 -
 55
55 -
 56
56 -
 57
57 -
 58
58 -
 59
59 -
 60
60 -
 61
61 -
 62
62 -
 63
63 -
 64
64 -
 65
65 -
 66
66 -
 67
67 -
 68
68 -
 69
69 -
 70
70 -
 71
71 -
 72
72 -
 73
73 -
 74
74 -
75
-
76
-
77
-
78
-
79
-
80
-
81
-
82
-
83
-
84
-
85
-
86
-
87
-
88
-
89
-
90
-
91
-
92
-
93
-
94
-
95
-
96
-
97
 |
 |

METLIFE, INC.
NOTES TO CONSOLIDATED FINANCIAL STATEMENTS — (Continued)
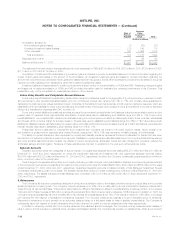
Assets on Deposit and Held in Trust
The Company had investment assets on deposit with regulatory agencies with a fair market value of $1,353 million and $975 million at
December 31, 2003 and 2002, respectively. Company securities held in trust to satisfy collateral requirements had an amortized cost of $2,276 million
and $1,949 million at December 31, 2003 and 2002, respectively.
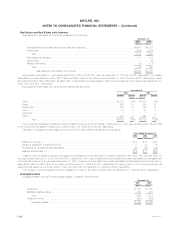
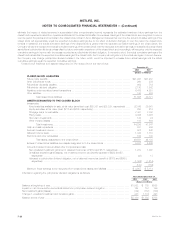
Mortgage Loans on Real Estate
Mortgage loans on real estate were categorized as follows:
December 31,
2003 2002
Amount Percent Amount Percent
(Dollars in millions)
Commercial mortgage loans********************************************************* $20,422 78% $19,671 78%
Agricultural mortgage loans********************************************************** 5,333 20 5,152 20
Residential mortgage loans********************************************************** 623 2 389 2
Total ******************************************************************** 26,378 100% 25,212 100%
Less: Valuation allowances ********************************************************** 129 126
Mortgage loans *********************************************************** $26,249 $25,086
Mortgage loans on real estate are collateralized by properties primarily located throughout the United States. At December 31, 2003, approximately
21%, 7% and 7% of the properties were located in California, New York and Florida, respectively. Generally, the Company (as the lender) requires that a
minimum of one-fourth of the purchase price of the underlying real estate be paid by the borrower.
Certain of the Company’s real estate joint ventures have mortgage loans with the Company. The carrying values of such mortgages were
$639 million and $620 million at December 31, 2003 and 2002, respectively.
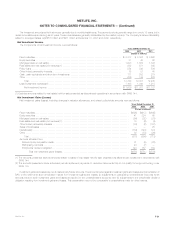
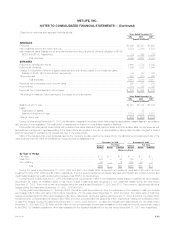
Changes in mortgage loan valuation allowances were as follows:
Years Ended December 31,
2003 2002 2001
(Dollars in millions)
Balance at January 1 **************************************************************************** $126 $144 $ 83
Additions ************************************************************************************** 52 41 106
Deductions************************************************************************************* (49) (59) (45)
Balance at December 31 ************************************************************************* $129 $126 $144
A portion of the Company’s mortgage loans on real estate was impaired and consisted of the following:
December 31,
2003 2002
(Dollars in millions)
Impaired mortgage loans with valuation allowances ********************************************************* $296 $627
Impaired mortgage loans without valuation allowances ****************************************************** 165 261
Total **************************************************************************************** 461 888
Less: Valuation allowances on impaired mortgages ********************************************************* 62 125
Impaired mortgage loans *********************************************************************** $399 $763
The average investment in impaired mortgage loans on real estate was $652 million, $1,088 million and $947 million for the years ended
December 31, 2003, 2002 and 2001, respectively. Interest income on impaired mortgage loans was $58 million, $91 million and $103 million for the
years ended December 31, 2003, 2002 and 2001, respectively.
The investment in restructured mortgage loans on real estate was $191 million and $414 million at December 31, 2003 and 2002, respectively.
Interest income of $19 million, $44 million and $76 million was recognized on restructured loans for the years ended December 31, 2003, 2002 and
2001, respectively. Gross interest income that would have been recorded in accordance with the original terms of such loans amounted to $24 million,
$41 million and $60 million for the years ended December 31, 2003, 2002 and 2001, respectively.
Mortgage loans on real estate with scheduled payments of 60 days (90 days for agriculture mortgages) or more past due or in foreclosure had an
amortized cost of $51 million and $40 million at December 31, 2003 and 2002, respectively.
MetLife, Inc. F-19