MetLife 2003 Annual Report Download - page 17
Download and view the complete annual report
Please find page 17 of the 2003 MetLife annual report below. You can navigate through the pages in the report by either clicking on the pages listed below, or by using the keyword search tool below to find specific information within the annual report.-
 1
1 -
2
-
3
-
4
-
5
-
6
-
 7
7 -
 8
8 -
 9
9 -
 10
10 -
 11
11 -
 12
12 -
 13
13 -
 14
14 -
 15
15 -
 16
16 -
 17
17 -
 18
18 -
 19
19 -
 20
20 -
 21
21 -
 22
22 -
 23
23 -
 24
24 -
 25
25 -
 26
26 -
 27
27 -
28
-
29
-
30
-
31
-
32
-
33
-
34
-
35
-
36
-
37
-
38
-
39
-
40
-
41
-
42
-
43
-
44
-
45
-
46
-
47
-
48
-
49
-
50
-
51
-
52
-
53
-
54
-
55
-
56
-
57
-
58
-
59
-
60
-
61
-
62
-
63
-
64
-
65
-
66
-
67
-
68
-
69
-
70
-
71
-
72
-
73
-
74
-
75
-
76
-
77
-
78
-
79
-
80
-
81
-
82
-
83
-
84
-
85
-
86
-
87
-
88
-
89
-
90
-
91
-
92
-
93
-
94
-
95
-
96
-
97
 |
 |
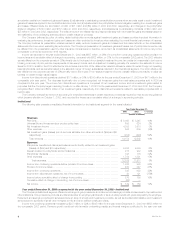
Universal life and investment-type product policy fees increased by $258 million, or 14%, to $2,147 million for the year ended December 31, 2002
from $1,889 million for the comparable 2001 period. This variance is primarily attributable to the Individual, International and Institutional segments. A
$119 million favorable variance in Individual is due to an increase in policy fees from insurance products, primarily due to higher revenue from insurance
fees, which increase as the average separate account asset base supporting the underlying minimum death benefits declines. The average separate
account asset base has declined in 2002 in response to poor equity market performance. These increases are partially offset by lower policy fees from
annuity and investment-type products generally resulting from poor equity market performance despite growth in annuity deposits. A $106 million
increase in International is largely due to the acquisition of Hidalgo and the acquisitions in Chile, partially offset by the cessation of product lines offered
through a joint venture with Banco Santander Central Hispano, S.A., (‘‘Banco Santander’’) in 2001. A $32 million increase in Institutional is principally due
to a fee related to the renegotiation of a portion of a bank-owned life insurance contract, as well as growth in existing business in the group universal life
product.
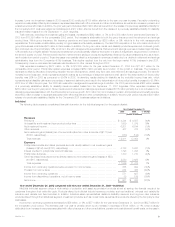
Net investment income increased by $74 million, or 1%, to $11,261 million for the year ended December 31, 2002 from $11,187 million for the
comparable 2001 period. This variance is primarily attributable to increases of (i) $58 million, or 1%, in income from fixed maturities, (ii) $62 million, or
15%, in income from real estate and real estate joint ventures held-for-investment, net of investment expenses and depreciation, (iii) $35 million, or 2%, in
income on mortgage loans on real estate, (iv) $7 million, or 1%, in interest income on policy loans, and (v) lower investment expenses of $9 million, or 4%.
These variances are partially offset by decreases of (i) $47 million, or 17%, in income on cash, cash equivalents and short-term investments,
(ii) $39 million, or 17%, in income on other invested assets, and (iii) $11 million, or 10%, in income from equity securities and other limited partnership
interests.
The increase in income from fixed maturities to $8,076 million in 2002 from $8,018 million in 2001 is largely due to a higher asset base, primarily
resulting from increased cash flows from sales of insurance and the acquisitions in Mexico and Chile. In addition, securities lending income was higher
due to increased activity and a more favorable cost of funds. The increases in income from fixed maturities are partially offset by decreases resulting from
lower reinvestment rates and a decline in bond prepayment fees. The increase in income from real estate and real estate joint ventures held-for-
investment to $477 million in 2002 from $415 million in 2001 is primarily due to the transfer of the Company’s One Madison Avenue, New York property
from a company use property to an investment property in 2002. The increase in income on mortgage loans on real estate to $1,883 million in 2002 from
$1,848 million in 2001 is due primarily to a higher asset base from new loan production, partially offset by lower mortgage rates. The increase in interest
income from policy loans to $543 million in 2002 from $536 million in 2001 is largely due to increased loans outstanding. The decrease in income from
cash, cash equivalents and short-term investments to $232 million in 2002 from $279 million in 2001 is due to declining interest rates coupled with a
decrease in the asset base. The decrease in net investment income from other invested assets to $186 million in 2002 from $225 million in 2001 is
largely due to lower derivative income, partially offset by an increase in reinsurance contracts’ funds withheld at interest. The decline in income from equity
securities and other limited partnership interests to $99 million in 2002 from $110 million in 2001 primarily resulted from lower dividend income from
equity securities, partially offset by higher limited corporate partnership distributions.
The increase in net investment income is attributable to increases in the International, Individual and Reinsurance segments, partially offset by
decreases in Corporate & Other, and the Institutional and Auto & Home segments. A $194 million increase in International is due to a higher asset base
resulting from the acquisitions in Mexico and Chile. Individual increased by $79 million primarily due to higher income from securities lending and limited
corporate partnership distributions, partially offset by lower bond prepayment fee income. The Reinsurance segment increased $31 million largely
resulting from an increase in reinsurance contracts’ funds withheld at interest. The decrease in Corporate & Other of $146 million is due to a lower asset
base, resulting from funding International’s acquisitions in Mexico and Chile, as well as the Company’s common stock repurchases, partially offset by
higher income from securities lending. Institutional decreased $49 million predominantly as a result of decreased limited partnership, equity-linked note
and bond prepayment fee income. Auto & Home decreased $23 million primarily due to lower reinvestment rates.
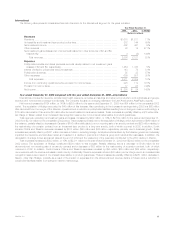
Other revenues decreased by $175 million, or 12%, to $1,332 million for the year ended December 31, 2002 from $1,507 million for the
comparable 2001 period. This variance is primarily attributable to decreases in the Individual, Institutional, Asset Management segments and Corporate &
Other. Individual decreased by $77 million resulting from lower commission and fee income associated with decreased volume in the broker/dealer and
other subsidiaries as a result of the depressed equity markets. A $40 million decrease in Institutional is primarily due to a $73 million reduction in
administrative fees as a result of the Company’s exit from the large market 401(k) business in late 2001, as well as lower fees earned on investments in
separate accounts resulting generally from poor equity market performance. This reduction is partially offset by a $33 million increase in group insurance
due to growth in the administrative service businesses and a settlement received in 2002 related to the Company’s former medical business. A
$32 million decrease in Asset Management is primarily due to the sale of Conning in July 2001. In addition, Corporate & Other decreased by $29 million
principally due to the remeasurement of the Company’s reinsurance recoverable associated with the sales practices reinsurance treaty in 2001, as well
as an increase in the elimination of intersegment activity. This was partially offset from a gain on the sale of a company-occupied building, and income
earned on corporate-owned life insurance (‘‘COLI’’) purchased during 2002.
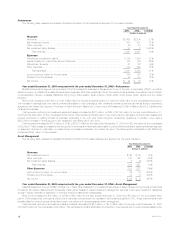
The Company’s investment gains and losses are net of related policyholder amounts. The amounts netted against investment gains and losses are
(i) amortization of DAC, to the extent that such amortization results from investment gains and losses, (ii) adjustments to participating contractholder
accounts when amounts equal to such investment gains and losses are applied to the contractholder’s accounts, and (iii) adjustments to the policyholder
dividend obligation resulting from investment gains and losses.
Net investment gains and losses increased by $172 million, or 30%, to $751 million for the year ended December 31, 2002 from $579 million for the
comparable 2001 period. This increase reflects total investment gains (losses), before offsets, of $896 million (including gross gains of $1,836 million,
gross losses of $1,091 million, writedowns of $1,501 million, and a net loss from derivatives of $140 million which includes scheduled periodic
settlement payments on derivatives that do not qualify for hedge accounting of $32 million), an increase of $183 million, or 26%, from $713 million in
2001. Offsets include the amortization of DAC of ($5) million and ($25) million in 2002 and 2001, respectively, and changes in the policyholder dividend
obligation of $157 million and $159 million in 2002 and 2001, respectively, and adjustments to participating contracts of ($7) million in 2002. Refer to
‘‘—Investments’’ beginning on page 28 for a discussion of the Company’s investment portfolio.
The Company believes its policy of netting related policyholder amounts against investment gains and losses provides important information in
evaluating its performance. Investment gains and losses are often excluded by investors when evaluating the overall financial performance of insurers.
The Company believes its presentation enables readers to easily exclude investment gains and losses and the related effects on the consolidated
statements of income when evaluating its performance. The Company’s presentation of investment gains and losses, net of policyholder amounts, may
be different from the presentation used by other insurance companies and, therefore, amounts in its consolidated statements of income may not be
comparable to amounts reported by other insurers.
MetLife, Inc.
14