MetLife 2003 Annual Report Download - page 16
Download and view the complete annual report
Please find page 16 of the 2003 MetLife annual report below. You can navigate through the pages in the report by either clicking on the pages listed below, or by using the keyword search tool below to find specific information within the annual report.-
 1
1 -
2
-
3
-
4
-
5
-
 6
6 -
 7
7 -
 8
8 -
 9
9 -
 10
10 -
 11
11 -
 12
12 -
 13
13 -
 14
14 -
 15
15 -
 16
16 -
 17
17 -
 18
18 -
 19
19 -
 20
20 -
 21
21 -
 22
22 -
 23
23 -
 24
24 -
 25
25 -
 26
26 -
27
-
28
-
29
-
30
-
31
-
32
-
33
-
34
-
35
-
36
-
37
-
38
-
39
-
40
-
41
-
42
-
43
-
44
-
45
-
46
-
47
-
48
-
49
-
50
-
51
-
52
-
53
-
54
-
55
-
56
-
57
-
58
-
59
-
60
-
61
-
62
-
63
-
64
-
65
-
66
-
67
-
68
-
69
-
70
-
71
-
72
-
73
-
74
-
75
-
76
-
77
-
78
-
79
-
80
-
81
-
82
-
83
-
84
-
85
-
86
-
87
-
88
-
89
-
90
-
91
-
92
-
93
-
94
-
95
-
96
-
97
 |
 |

management, despite an increase in ending assets under management of 7% to $47.5 billion for the year ended December 31, 2003 from $44.6 billion
for the comparable 2002 period. In addition, performance fees of $10 million earned during 2003 on certain investment products, were lower than the
$14 million earned during the comparable 2002 period.
Other expenses decreased by $29 million, or 14%, to $182 million for the year ended December 31, 2003 from $211 million for the comparable
2002 period. Compensation-related expenses declined $17 million primarily as a result of staff reductions undertaken in the third and fourth quarters of
2002. Additionally, variable expenses declined $6 million largely as a result of lower average assets under management. General and administrative
expenses declined $6 million due to lower spending.
Corporate & Other
Year ended December 31, 2003 compared with the year ended December 31, 2002—Corporate & Other
Corporate & Other contains the excess capital not allocated to the business segments, as well as expenses associated with the resolution of
proceedings alleging race-conscious underwriting practices, sales practices and asbestos related claims, and interest expense related to the majority of
the Company’s outstanding debt.
Income and loss from continuing operations increased by $485 million, or 111%, to $48 million for the year ended December 31, 2003 from a loss
of $437 million for the comparable 2002 period. The 2003 period includes a $92 million after-tax benefit from a reduction of a previously established
liability related to the Company’s race conscious underwriting settlement and a $36 million benefit from a revision of the estimate of income tax for 2002.
The 2002 period includes a $169 million after-tax charge to cover costs associated with asbestos-related claims, a $48 million after-tax charge to cover
costs associated with the resolution of a federal government investigation of General American Life Insurance Company’s (‘‘General American’’) former
Medicare business, and a $30 million after-tax reduction of a previously established liability related to the Company’s sales practice class action
settlement in 1999. Excluding the impact of these items, the increase in earnings year over year is mainly due to higher investment income.
Total revenues, excluding net investment gains and losses, increased by $201 million, or 1,117%, to $219 million for the year ended December 31,
2003 from $18 million for the comparable 2002 period. This variance is mainly due to higher investment income resulting from the change in capital
allocation methodology, as well as increases in income from corporate joint ventures, equity-linked notes and securities lending.
Total expenses decreased by $421 million, or 58%, to $304 million for the year ended December 31, 2003 from $725 million for the comparable
2002 period. The 2003 period includes a $144 million reduction of a previously established liability related to the Company’s race-conscious underwriting
settlement. The 2002 period includes a $266 million charge to increase the Company’s asbestos-related liability and expenses to cover costs associated
with the resolution of federal government investigations of General American’s former Medicare business.
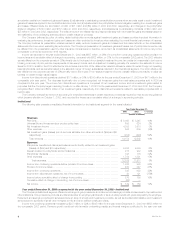
Year ended December 31, 2002 compared with the year ended December 31, 2001—The Company
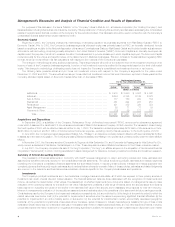
The following table presents consolidated financial information for the years indicated:
Year Ended December 31,
2002 2001 % Change
(Dollars in millions)
Revenues
Premiums ********************************************************************** $19,077 $17,212 11 %
Universal life and investment-type product policy fees ********************************* 2,147 1,889 14 %
Net investment income *********************************************************** 11,261 11,187 1 %
Other revenues****************************************************************** 1,332 1,507 (12)%
Net investment gains (losses) (net of amounts allocable to other accounts of ($145) and
($134), respectively)************************************************************ (751) (579) 30 %
Total revenues ************************************************************** 33,066 31,216 6 %
Expenses
Policyholder benefits and claims (excludes amounts directly related to net investment gains
(losses) of ($150) and ($159), respectively) **************************************** 19,523 18,454 6 %
Interest credited to policyholder account balances ************************************ 2,950 3,084 (4)%
Policyholder dividends ************************************************************ 1,942 2,086 (7)%
Other expenses (excludes amounts directly related to net investment gains (losses) of $5
and $25, respectively) ********************************************************** 7,015 7,022 (0)%
Total expenses ************************************************************** 31,430 30,646 3 %
Income from continuing operations before provision for income taxes********************* 1,636 570 187 %
Provision for income taxes ******************************************************** 502 204 146 %
Income from continuing operations ************************************************* 1,134 366 210 %
Income from discontinued operations, net of income taxes ***************************** 471 107 340 %
Net income ********************************************************************* $ 1,605 $ 473 239 %
Premiums increased by $1,865 million, or 11%, to $19,077 million for the year ended December 31, 2002 from $17,212 million for the comparable
2001 period. This variance is primarily attributable to increases in the Institutional, International and Reinsurance segments. A $957 million increase in
Institutional is largely due to sales growth in its group life, dental, disability and long-term care businesses, a sale of a significant retirement and savings
contract in the second quarter of 2002, as well as new sales throughout 2002 in this segment’s structured settlements and traditional annuity products.
The June 2002 acquisition of Hidalgo, the 2001 acquisitions in Chile and Brazil and the sale of an annuity contract in the first quarter of 2002 to a
Canadian trust company are the primary drivers of a $665 million increase in International. A portion of the increase in International is also attributable to
business growth in South Korea, Mexico (excluding Hidalgo) and Taiwan. In addition, an increase in Canada due to the restructuring of a pension contract
from an investment-type product to a long-term annuity contributed to this variance. New premiums from facultative and automatic treaties, and renewal
premiums on existing blocks of business contributed to a $243 million increase in the Reinsurance segment.
MetLife, Inc. 13