MetLife 2003 Annual Report Download - page 33
Download and view the complete annual report
Please find page 33 of the 2003 MetLife annual report below. You can navigate through the pages in the report by either clicking on the pages listed below, or by using the keyword search tool below to find specific information within the annual report.-
 1
1 -
2
-
3
-
4
-
5
-
6
-
7
-
8
-
9
-
10
-
11
-
12
-
13
-
14
-
15
-
16
-
17
-
18
-
19
-
20
-
21
-
22
-
 23
23 -
 24
24 -
 25
25 -
 26
26 -
 27
27 -
 28
28 -
 29
29 -
 30
30 -
 31
31 -
 32
32 -
 33
33 -
 34
34 -
 35
35 -
 36
36 -
 37
37 -
 38
38 -
 39
39 -
 40
40 -
 41
41 -
 42
42 -
 43
43 -
44
-
45
-
46
-
47
-
48
-
49
-
50
-
51
-
52
-
53
-
54
-
55
-
56
-
57
-
58
-
59
-
60
-
61
-
62
-
63
-
64
-
65
-
66
-
67
-
68
-
69
-
70
-
71
-
72
-
73
-
74
-
75
-
76
-
77
-
78
-
79
-
80
-
81
-
82
-
83
-
84
-
85
-
86
-
87
-
88
-
89
-
90
-
91
-
92
-
93
-
94
-
95
-
96
-
97
 |
 |

gains and losses include $421 million and $582 million of gains classified as discontinued operations for the years ended December 31, 2003 and
2002, respectively. There were no net investment gains and losses classified as discontinued operations for the year ended December 31, 2001.
(5) Investment income from other invested assets includes scheduled periodic settlement payments on derivative instruments that do not qualify for
hedge accounting under SFAS 133 of $84 million, $32 million and $24 million for the years ended December 31, 2003, 2002 and 2001,
respectively. These amounts are excluded from net investment gains and losses from other invested assets.
(6) Adjustments to investment gains and losses include amortization of DAC, charges and credits to participating contracts and adjustments to the
policyholder dividend obligation resulting from investment gains and losses.
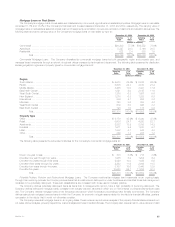
Fixed Maturities
Fixed maturities consist principally of publicly traded and privately placed debt securities, and represented 75.6% and 73.6% of total cash and
invested assets at December 31, 2003 and 2002, respectively. Based on estimated fair value, public fixed maturities represented $147,489 million, or
87.9%, and $121,191 million, or 86.4%, of total fixed maturities at December 31, 2003 and 2002, respectively. Based on estimated fair value, private
fixed maturities represented $20,263 million, or 12.1%, and $19,097 million, or 13.6%, of total fixed maturities at December 31, 2003 and 2002,
respectively. The Company invests in privately placed fixed maturities to (i) obtain higher yields than can ordinarily be obtained with comparable public
market securities; (ii) provide the Company with protective covenants, call protection features and, where applicable, a higher level of collateral; and
(iii) increase diversification. However, the Company may not freely trade its privately placed fixed maturities because of restrictions imposed by federal and
state securities laws and illiquid markets.
In cases where quoted market prices are not available, fair values are estimated using present value or valuation techniques. The fair value estimates
are made at a specific point in time, based on available market information and judgments about the financial instruments, including estimates of the
timing and amounts of expected future cash flows and the credit standing of the issuer or counter-party. Factors considered in estimating fair value
include: coupon rate, maturity, estimated duration, call provisions, sinking fund requirements, credit rating, industry sector of the issuer and quoted
market prices of comparable securities.
The Securities Valuation Office of the NAIC evaluates the fixed maturity investments of insurers for regulatory reporting purposes and assigns
securities to one of six investment categories called ‘‘NAIC designations.’’ The NAIC ratings are similar to the rating agency designations of the Nationally
Recognized Statistical Rating Organizations for marketable bonds. NAIC ratings 1 and 2 include bonds generally considered investment grade (rated
‘‘Baa3’’ or higher by Moody’s Investors Services (‘‘Moody’s’’), or rated ‘‘BBB–’’ or higher by Standard & Poor’s (‘‘S&P’’)) by such rating organizations. NAIC
ratings 3 through 6 include bonds generally considered below investment grade (rated ‘‘Ba1’’ or lower by Moody’s, or rated ‘‘BB+’’ or lower by S&P).
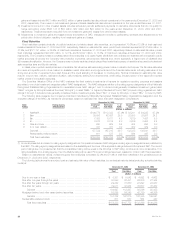
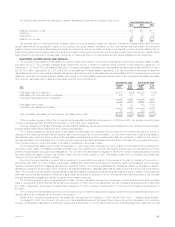
The following table presents the Company’s total fixed maturities by Nationally Recognized Statistical Rating Organizations designation and the
equivalent ratings of the NAIC, as well as the percentage, based on estimated fair value, that each designation comprises at:
December 31, 2003 December 31, 2002
NAIC Rating Agency Amortized Estimated % of Amortized Estimated % of
Rating Designation(1) Cost Fair Value Total Cost Fair Value Total
(Dollars in millions)
1 Aaa/Aa/A****************************************** $106,779 $112,333 67.0% $ 88,201 $ 94,225 67.2%
2 Baa ********************************************** 39,006 42,057 25.0 32,093 33,997 24.2
3Ba*********************************************** 7,388 8,011 4.8 7,519 7,437 5.3
4B************************************************ 3,578 3,814 2.3 3,636 3,408 2.4
5 Caa and lower ************************************* 630 629 0.4 404 295 0.3
6 In or near default *********************************** 341 371 0.2 482 479 0.3
Subtotal******************************************* 157,722 167,215 99.7 132,335 139,841 99.7
Redeemable preferred stock************************** 611 537 0.3 564 447 0.3
Total fixed maturities********************************* $158,333 $167,752 100.0% $132,899 $140,288 100.0%
(1) Amounts presented are based on rating agency designations. Comparisons between NAIC ratings and rating agency designations are published by
the NAIC. The rating agency designations are based on the availability and the lower of the applicable ratings between Moody’s and S&P. The current
period ratings are now presented so that the consolidated rating will be equal to the Moody’s or S&P rating, whichever is more conservative. If no
rating is available from a rating agency, then the MetLife rating will be used. Prior period ratings have been restated to conform with this presentation.
Based on estimated fair values, investment grade fixed maturities comprised 92.0% and 91.4% of total fixed maturities in the general account at
December 31, 2003 and 2002, respectively.
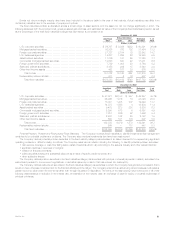
The following table shows the amortized cost and estimated fair value of fixed maturities, by contractual maturity dates (excluding scheduled sinking
funds) at:
December 31, 2003 December 31, 2002
Amortized Estimated Amortized Estimated
Cost Fair Value Cost Fair Value
(Dollars in millions)
Due in one year or less ***************************************************** $ 5,381 $ 5,542 $ 4,592 $ 4,662
Due after one year through five years ****************************************** 30,893 32,431 26,200 27,354
Due after five years through ten years ***************************************** 29,342 31,830 23,297 24,987
Due after ten years ********************************************************* 39,011 43,064 35,507 38,452
Subtotal ************************************************************** 104,627 112,867 89,596 95,455
Mortgage-backed and other asset-backed securities ***************************** 53,095 54,348 42,739 44,386
Subtotal ************************************************************** 157,722 167,215 132,335 139,841
Redeemable preferred stock ************************************************* 611 537 564 447
Total fixed maturities **************************************************** $158,333 $167,752 $132,899 $140,288
MetLife, Inc.
30