MetLife 2003 Annual Report Download - page 39
Download and view the complete annual report
Please find page 39 of the 2003 MetLife annual report below. You can navigate through the pages in the report by either clicking on the pages listed below, or by using the keyword search tool below to find specific information within the annual report.-
 1
1 -
2
-
3
-
4
-
5
-
6
-
7
-
8
-
9
-
10
-
11
-
12
-
13
-
14
-
15
-
16
-
17
-
18
-
19
-
20
-
21
-
22
-
23
-
24
-
25
-
26
-
27
-
28
-
 29
29 -
 30
30 -
 31
31 -
 32
32 -
 33
33 -
 34
34 -
 35
35 -
 36
36 -
 37
37 -
 38
38 -
 39
39 -
 40
40 -
 41
41 -
 42
42 -
 43
43 -
 44
44 -
 45
45 -
 46
46 -
 47
47 -
 48
48 -
 49
49 -
50
-
51
-
52
-
53
-
54
-
55
-
56
-
57
-
58
-
59
-
60
-
61
-
62
-
63
-
64
-
65
-
66
-
67
-
68
-
69
-
70
-
71
-
72
-
73
-
74
-
75
-
76
-
77
-
78
-
79
-
80
-
81
-
82
-
83
-
84
-
85
-
86
-
87
-
88
-
89
-
90
-
91
-
92
-
93
-
94
-
95
-
96
-
97
 |
 |

coverage ratios for restructured loans, delinquent loans, loans under foreclosure, potentially delinquent loans, loans with an existing valuation allowance,
loans maturing within two years and loans with a loan-to-value ratio greater than 90% as determined in the prior year.
The principal risks in holding commercial mortgage loans are property specific, supply and demand, financial and capital market risks. Property
specific risks include the geographic location of the property, the physical condition of the property, the diversification of tenants and the rollover of their
leases and the ability of the property manager to attract tenants and manage expenses. Supply and demand risks include changes in the supply and/or
demand for rental space, which cause changes in vacancy rates and/or rental rates. Financial risks include the overall level of debt on the property and
the amount of principal repaid during the loan term. Capital market risks include the general level of interest rates, the liquidity for these securities in the
marketplace and the capital available for loan refinancing.
The Company establishes valuation allowances for loans that it deems impaired, as determined through its mortgage review process. The
Company’s valuation allowance is established both on a loan specific basis for those loans where a property or market specific risk has been identified
that could likely result in a future default, as well as for pools of loans with similar high risk characteristics where a property specific or market risk has not
been identified. Loans that are individually reviewed are evaluated based on the definition of impaired loans consistent with SFAS No. 114, Accounting by
Creditors for Impairments of a Loan (‘‘SFAS 114’’), as loans on which it probably will not collect all amounts due according to applicable contractual terms
of the agreement. The Company bases valuation allowances upon the present value of expected future cash flows discounted at the loan’s original
effective interest rate or the value of the loan’s collateral. The Company records valuation allowances as investment losses. The Company records
subsequent adjustments to allowances as investment gains or losses. The allowance for loan loss for pools of other loans with similar characteristics is
established in accordance with SFAS No. 5, Accounting for Contingencies (‘‘SFAS 5’’), when a loss contingency exists. A loss contingency exists when
the likelihood that a future event will occur is probable based on past events. SFAS 5 works in conjunction with, but does not overlap with, SFAS 114.
The Company applies SFAS 5 to groups of loans with similar characteristics based on property types and loan to value risk factors. The Company
records adjustments to its loan loss allowance as investment losses.
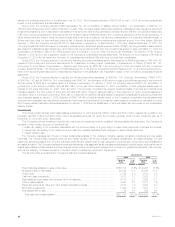
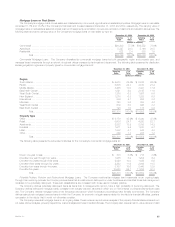
The following table presents the amortized cost and valuation allowance for commercial mortgage loans distributed by loan classification at:
December 31, 2003 December 31, 2002
% of % of
Amortized % of Valuation Amortized Amortized % of Valuation Amortized
Cost(1) Total Allowance Cost Cost(1) Total Allowance Cost
(Dollars in millions)
Performing ************************************* $20,315 99.5% $ 95 0.5% $19,343 98.3% $ 60 0.3%
Restructured *********************************** 77 0.4 23 29.9% 246 1.3 49 19.9%
Delinquent or under foreclosure ******************* — 0.0 — 0.0% 14 0.1 — 0.0%
Potentially delinquent **************************** 30 0.1 4 13.3% 68 0.3 10 14.7%
Total ********************************** $20,422 100.0% $122 0.6% $19,671 100.0% $119 0.6%
(1) Amortized cost is equal to carrying value before valuation allowances.
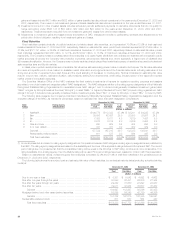
The following table presents the changes in valuation allowances for commercial mortgage loans for the:
Years Ended December 31,
2003 2002 2001
(Dollars in millions)
Balance, beginning of year ***************************************************************** $119 $134 $ 76
Additions ******************************************************************************** 51 38 84
Deductions ****************************************************************************** (48) (53) (26)
Balance, end of year ********************************************************************** $122 $119 $134
Agricultural Mortgage Loans. The Company diversifies its agricultural mortgage loans by both geographic region and product type. The Company
manages these investments through a network of regional offices and field professionals overseen by its investment department.
Approximately 67% of the $5,327 million of agricultural mortgage loans outstanding at December 31, 2003 were subject to rate resets prior to
maturity. A substantial portion of these loans generally is successfully renegotiated and remains outstanding to maturity. The process and policies for
monitoring the agricultural mortgage loans and classifying them by performance status are generally the same as those for the commercial loans.
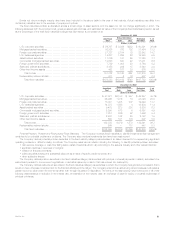
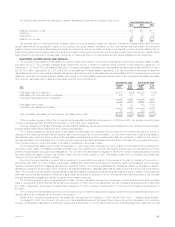
The following table presents the amortized cost and valuation allowances for agricultural mortgage loans distributed by loan classification at:
December 31, 2003 December 31, 2002
% of % of
Amortized % of Valuation Amortized Amortized % of Valuation Amortized
Cost(1) Total Allowance Cost Cost(1) Total Allowance Cost
(Dollars in millions)
Performing ************************************* $5,162 96.7% $— 0.0% $4,980 96.7% $ — 0.0%
Restructured *********************************** 111 2.1 1 0.9% 140 2.7 5 3.6%
Delinquent or under foreclosure ******************* 36 0.7 2 5.6% 14 0.3 — 0.0%
Potentially delinquent **************************** 24 0.5 3 12.5% 18 0.3 1 5.6%
Total ********************************** $5,333 100.0% $ 6 0.1% $5,152 100.0% $ 6 0.1%
(1) Amortized cost is equal to carrying value before valuation allowances.
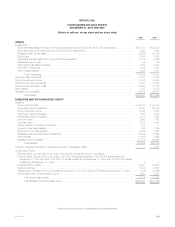
MetLife, Inc.
36