MetLife 2003 Annual Report Download - page 88
Download and view the complete annual report
Please find page 88 of the 2003 MetLife annual report below. You can navigate through the pages in the report by either clicking on the pages listed below, or by using the keyword search tool below to find specific information within the annual report.-
 1
1 -
2
-
3
-
4
-
5
-
6
-
7
-
8
-
9
-
10
-
11
-
12
-
13
-
14
-
15
-
16
-
17
-
18
-
19
-
20
-
21
-
22
-
23
-
24
-
25
-
26
-
27
-
28
-
29
-
30
-
31
-
32
-
33
-
34
-
35
-
36
-
37
-
38
-
39
-
40
-
41
-
42
-
43
-
44
-
45
-
46
-
47
-
48
-
49
-
50
-
51
-
52
-
53
-
54
-
55
-
56
-
57
-
58
-
59
-
60
-
61
-
62
-
63
-
64
-
65
-
66
-
67
-
68
-
69
-
70
-
71
-
72
-
73
-
74
-
75
-
76
-
77
-
 78
78 -
 79
79 -
 80
80 -
 81
81 -
 82
82 -
 83
83 -
 84
84 -
 85
85 -
 86
86 -
 87
87 -
 88
88 -
 89
89 -
 90
90 -
 91
91 -
 92
92 -
 93
93 -
 94
94 -
 95
95 -
 96
96 -
 97
97
 |
 |

METLIFE, INC.
NOTES TO CONSOLIDATED FINANCIAL STATEMENTS — (Continued)
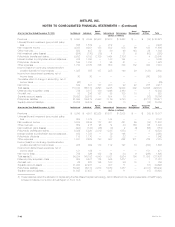
Other Comprehensive Income
The following table sets forth the reclassification adjustments required for the years ended December 31, 2003, 2002 and 2001 in other
comprehensive income (loss) that are included as part of net income for the current year that have been reported as a part of other comprehensive
income (loss) in the current or prior year:
Years Ended December 31,
2003 2002 2001
(Dollars in millions)
Holding gains on investments arising during the year *********************************************** $1,549 $3,755 $1,343
Income tax effect of holding gains*************************************************************** (582) (1,179) (530)
Reclassification adjustments:
Recognized holding losses included in current year income *************************************** 330 336 510
Amortization of premiums and accretion of discounts associated with investments ******************** (168) (526) (488)
Recognized holding gains allocated to other policyholder amounts********************************** (215) (145) (134)
Income tax effect*************************************************************************** 20 105 45
Allocation of holding losses on investments relating to other policyholder amounts ********************** (391) (2,832) (69)
Income tax effect of allocation of holding losses to other policyholder amounts ************************* 147 889 27
Net unrealized investment gains **************************************************************** 690 403 704
Foreign currency translation adjustment ********************************************************** 177 (69) (60)
Minimum pension liability adjustment************************************************************* (82) — (18)
Other comprehensive income ****************************************************************** $ 785 $ 334 $ 626
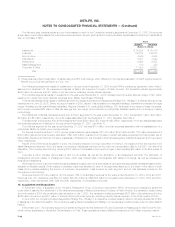
15. Other Expenses
Other expenses were comprised of the following:
Years Ended December 31,
2003 2002 2001
(Dollars in millions)
Compensation****************************************************************************** $ 2,685 $ 2,481 $ 2,459
Commissions ****************************************************************************** 2,474 2,000 1,651
Interest and debt issue costs ***************************************************************** 478 403 332
Amortization of policy acquisition costs (excludes amounts directly related to net investment gains (losses))
of $(31), $5 and $25, respectively) ********************************************************** 1,818 1,639 1,413
Capitalization of policy acquisition costs ******************************************************** (2,792) (2,340) (2,039)
Rent, net of sublease income ***************************************************************** 254 295 282
Minority interest***************************************************************************** 110 73 57
Other ************************************************************************************* 2,274 2,464 2,867
Total other expenses ********************************************************************** $ 7,301 $ 7,015 $ 7,022
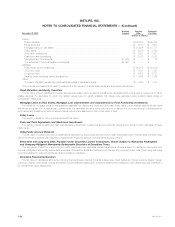
16. Earnings Per Share
The following presents a reconciliation of the weighted average shares used in calculating basic earnings per share to those used in calculating
diluted earnings per share:
For the Years Ended December 31,
2003 2002 2001
(Dollars in millions, except share and per share data)
Weighted average common stock outstanding for basic earnings per share ********* 737,903,107 704,599,115 741,041,654
Incremental shares from assumed:
Conversion of forward purchase contracts *********************************** 8,293,269 24,596,950 25,974,114
Exercise of stock options************************************************** 68,111 5,233 1,133
Issuance under deferred stock compensation********************************* 579,810 — —
Weighted average common stock outstanding for diluted earnings per share ******** 746,844,297 729,201,298 767,016,901
Income from continuing operations *************************************** $ 1,943 $ 1,134 $ 366
Charge for conversion of company-obligated mandatorily redeemable securities of a
subsidiary trust(1) ******************************************************** (21) — —
Income from continuing operations available to common shareholders ***** $ 1,922 $ 1,134 $ 366
Basic earnings per share ************************************************** $ 2.60 $ 1.61 $ 0.49
Diluted earnings per share************************************************* $ 2.57 $ 1.56 $ 0.48
MetLife, Inc. F-43