MetLife 2003 Annual Report Download - page 10
Download and view the complete annual report
Please find page 10 of the 2003 MetLife annual report below. You can navigate through the pages in the report by either clicking on the pages listed below, or by using the keyword search tool below to find specific information within the annual report.-
 1
1 -
 2
2 -
 3
3 -
 4
4 -
 5
5 -
 6
6 -
 7
7 -
 8
8 -
 9
9 -
 10
10 -
 11
11 -
 12
12 -
 13
13 -
 14
14 -
 15
15 -
 16
16 -
 17
17 -
 18
18 -
 19
19 -
 20
20 -
 21
21 -
22
-
23
-
24
-
25
-
26
-
27
-
28
-
29
-
30
-
31
-
32
-
33
-
34
-
35
-
36
-
37
-
38
-
39
-
40
-
41
-
42
-
43
-
44
-
45
-
46
-
47
-
48
-
49
-
50
-
51
-
52
-
53
-
54
-
55
-
56
-
57
-
58
-
59
-
60
-
61
-
62
-
63
-
64
-
65
-
66
-
67
-
68
-
69
-
70
-
71
-
72
-
73
-
74
-
75
-
76
-
77
-
78
-
79
-
80
-
81
-
82
-
83
-
84
-
85
-
86
-
87
-
88
-
89
-
90
-
91
-
92
-
93
-
94
-
95
-
96
-
97
 |
 |

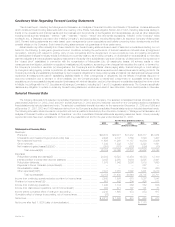
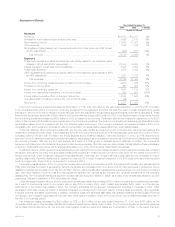
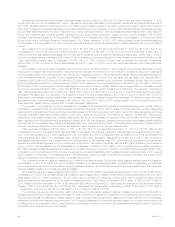
Discussion of Results
Year Ended December 31,
2003 2002 % Change
(Dollars in millions)
Revenues
Premiums ********************************************************************** $20,673 $19,077 8%
Universal life and investment-type product policy fees ********************************* 2,496 2,147 16%
Net investment income *********************************************************** 11,636 11,261 3%
Other revenues****************************************************************** 1,342 1,332 1%
Net investment gains (losses) (net of amounts allocable from other accounts of ($215) and
($145), respectively)************************************************************ (358) (751) 52%
Total revenues ************************************************************** 35,789 33,066 8%
Expenses
Policyholder benefits and claims (excludes amounts directly related to net investment gains
(losses) of ($184) and ($150), respectively) **************************************** 20,848 19,523 7%
Interest credited to policyholder account balances ************************************ 3,035 2,950 3%
Policyholder dividends ************************************************************ 1,975 1,942 2%
Other expenses (excludes amounts directly related to net investment gains (losses) of ($31)
and $5, respectively) *********************************************************** 7,301 7,015 4%
Total expenses ************************************************************** 33,159 31,430 6%
Income from continuing operations before provision for income taxes********************* 2,630 1,636 61%
Provision for income taxes ******************************************************** 687 502 37%
Income from continuing operations ************************************************* 1,943 1,134 71%
Income from discontinued operations, net of income taxes ***************************** 300 471 (36)%
Income before cumulative effect of change in accounting ****************************** 2,243 1,605 40%
Cumulative effect of change in accounting, net of income taxes ************************* (26) —
Net income ********************************************************************* $ 2,217 $ 1,605 38%
Income from continuing operations increased by $809 million, or 71%, to $1,943 million for the year ended December 31, 2003 from $1,134 million
in the comparable 2002 period. Income from continuing operations for the years 2003 and 2002 includes the impact of certain transactions or events
that result in net income not being indicative of future earnings, which are described in the applicable segment’s results of operations discussions. These
items contributed an after-tax benefit of $159 million in 2003 and an after-tax charge of $150 million in 2002. Excluding the impact of these items, income
from continuing operations increased by $500 million in 2003 compared to the prior year. Declines in after-tax net investment losses account for $220
million of this increase with the balance being contributed by the Company’s operations. The decline in net investment losses is largely attributable to less
credit-related losses, which is consistent with the U.S. financial market environment. The Company anticipates net investment losses in 2004 to be
comparable with 2003 levels and continues to reflect a concentration of interest-related losses rather than credit-related losses.
Premiums, fees and other revenues increased 9% over the prior year primarily as a result of growth in the annuities, retirement and savings and
variable and universal life product lines. This increase stems in part from policy fee income earned on annuity deposits, which were $11.2 billion in 2003,
increasing 42% from the prior year. In addition, the annuity separate account balance was $28.7 billion at December 31, 2003, up 57% versus the prior
year end. Growth in retirement & savings is primarily attributable to higher sales in structured settlement products. Fee income from variable and universal
life products increased 12% over the prior year primarily as a result of a 25% growth in separate account balances. In addition, the coinsurance
agreement with Allianz Life in the Reinsurance segment contributed approximately 1% to the year over year increase. Partially offsetting these increases is
a decline in traditional life premiums, which is largely attributable to run off in the Company’s closed block of business.
Investment margins, which represent the spread between net investment income and interest credited to policyholder account balances, remained
favorable in 2003 as the Company took appropriate crediting rate reductions in most products in an effort to keep pace with the market environment. In
several product lines, where investment margins are a substantial part of earnings, the Company still has a reasonable amount of flexibility to reduce
crediting rates further if portfolio yields were to decline from year-end 2003 levels. Investment margins in 2003 did benefit from higher than expected
levels of prepayments, a trend that is not expected to continue in 2004.
Underwriting results varied in 2003. The group life mortality ratio continues to be favorable at 92%. The Individual life mortality ratio was also solid at
88%, which includes the impact of several large claims in the variable and universal product line, some of which had lower levels of reinsurance. Group
disability’s morbidity ratio increased to 98.5%, from 97.9% in the prior year but is still within management’s expected range. The Auto & Home combined
ratio, which is a measure of both the loss and loss adjustment expense ratio, as well as the expense ratio, remained favorable at 97.1% excluding
catastrophes. The Company’s International segment increased its loss recognition reserve in Taiwan as a result of low interest rates relative to product
guarantees. This action resulted in a $19 million after-tax charge.
Other expenses increased 4% over the prior year period primarily as a result of an increase of $133 million in pension and postretirement expenses.
As a result of contributions made to the pension plan in late 2003 and early 2004, which totaled approximately $750 million, and the stronger
performance of the pension plan assets in 2003, the Company anticipates the pension and postretirement expenses to moderate in 2004. Other
expenses in 2003 also include the impact of several actions taken by management in the fourth quarter, including lease terminations, office consolida-
tions and closures, and asset impairments. In addition, severance costs and expenses associated with strategic initiatives at New England Financial
contributed to the increase in expenses year over year. Also, there was an increase in many of the product lines’ volume-related expenses, which are in
line with 2003 business growth.
Net investment losses decreased by $393 million, or 52%, to $358 million for the year ended December 31, 2003 from $751 million for the
comparable 2002 period. This decrease reflects total investment losses, before offsets, of $573 million. The Company’s investment gains and losses are
net of related policyholder amounts. The amounts netted against investment gains and losses are (i) amortization of DAC, to the extent that such
MetLife, Inc. 7