MetLife 2003 Annual Report Download - page 91
Download and view the complete annual report
Please find page 91 of the 2003 MetLife annual report below. You can navigate through the pages in the report by either clicking on the pages listed below, or by using the keyword search tool below to find specific information within the annual report.-
 1
1 -
2
-
3
-
4
-
5
-
6
-
7
-
8
-
9
-
10
-
11
-
12
-
13
-
14
-
15
-
16
-
17
-
18
-
19
-
20
-
21
-
22
-
23
-
24
-
25
-
26
-
27
-
28
-
29
-
30
-
31
-
32
-
33
-
34
-
35
-
36
-
37
-
38
-
39
-
40
-
41
-
42
-
43
-
44
-
45
-
46
-
47
-
48
-
49
-
50
-
51
-
52
-
53
-
54
-
55
-
56
-
57
-
58
-
59
-
60
-
61
-
62
-
63
-
64
-
65
-
66
-
67
-
68
-
69
-
70
-
71
-
72
-
73
-
74
-
75
-
76
-
77
-
78
-
79
-
80
-
 81
81 -
 82
82 -
 83
83 -
 84
84 -
 85
85 -
 86
86 -
 87
87 -
 88
88 -
 89
89 -
 90
90 -
 91
91 -
 92
92 -
 93
93 -
 94
94 -
 95
95 -
 96
96 -
 97
97
 |
 |

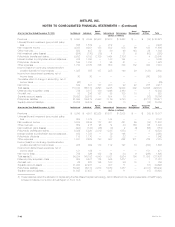
METLIFE, INC.
NOTES TO CONSOLIDATED FINANCIAL STATEMENTS — (Continued)
Auto & Asset Corporate
At or for the Year Ended December 31, 2003 Institutional Individual Home International Reinsurance Management & Other Total
(Dollars in millions)
Premiums *********************************** $ 9,093 $ 4,344 $2,908 $1,678 $ 2,668 $ — $ (18) $ 20,673
Universal life and investment-type product policy
fees ************************************** 635 1,589 — 272 — — — 2,496
Net investment income ************************ 4,038 6,201 158 502 473 66 198 11,636
Other revenues******************************* 592 407 32 80 49 143 39 1,342
Net investment gains (losses) ******************* (204) (130) (15) 4 31 9 (53) (358)
Policyholder benefits and claims***************** 9,932 5,183 2,139 1,454 2,136 — 4 20,848
Interest credited to policyholder account balances** 915 1,793 — 143 184 — — 3,035
Policyholder dividends ************************* 198 1,700 1 55 21 — — 1,975
Other expenses ****************************** 1,784 2,880 756 659 740 182 300 7,301
Income (loss) from continuing operations before
provision (benefit) for income taxes ************ 1,325 855 187 225 140 36 (138) 2,630
Income from discontinued operations, net of
income taxes ****************************** 30 30 — — — — 240 300
Cumulative effect of change in accounting, net of
income taxes ****************************** (26) — — — — — — (26)
Net income ********************************** 849 601 157 208 92 22 288 2,217
Total assets********************************** 113,743 165,774 4,698 9,935 12,833 302 19,556 326,841
Deferred policy acquisition costs **************** 739 8,817 180 1,046 2,160 — 1 12,943
Goodwill, net********************************* 59 206 157 85 100 18 3 628
Separate account assets ********************** 35,632 39,619 — 504 13 — (12) 75,756
Policyholder liabilities ************************** 61,599 100,278 2,943 7,179 9,783 — (2,211) 179,571
Separate account liabilities ********************* 35,632 39,619 — 504 13 — (12) 75,756
Auto & Asset Corporate
At or for the Year Ended December 31, 2002 Institutional Individual Home International Reinsurance Management & Other Total
(Dollars in millions)
Premiums *********************************** $ 8,245 $ 4,507 $2,828 $1,511 $ 2,005 $ — $ (19) $ 19,077
Universal life and investment-type product policy
fees ************************************** 624 1,379 — 144 — — — 2,147
Net investment income ************************ 3,918 6,244 177 461 421 59 (19) 11,261
Other revenues******************************* 609 418 26 14 43 166 56 1,332
Net investment gains (losses) ******************* (494) (144) (46) (9) 2 (4) (56) (751)
Policyholder benefits and claims***************** 9,339 5,220 2,019 1,388 1,554 — 3 19,523
Interest credited to policyholder account balances** 932 1,793 — 79 146 — — 2,950
Policyholder dividends ************************* 115 1,770 — 35 22 — — 1,942
Other expenses ****************************** 1,531 2,629 793 507 622 211 722 7,015
Income (loss) from continuing operations before
provision (benefit) for income taxes ************ 985 992 173 112 127 10 (763) 1,636
Income from discontinued operations, net of
income taxes ****************************** 121 199 — — — — 151 471
Net income (loss) ***************************** 759 826 132 84 84 6 (286) 1,605
Total assets(1)******************************** 98,234 145,152 4,540 8,301 9,924 190 11,085 277,426
Deferred policy acquisition costs **************** 608 8,521 175 945 1,477 — 1 11,727
Goodwill, net********************************* 62 223 155 193 96 18 3 750
Separate account assets ********************** 31,935 27,457 — 307 11 — (17) 59,693
Policyholder liabilities ************************** 55,497 95,813 2,673 5,883 7,387 — (2,011) 165,242
Separate account liabilities ********************* 31,935 27,457 — 307 11 — (17) 59,693
(1) These balances reflect the allocation of capital using the Risk-Based Capital methodology, which differs from the original presentation of GAAP equity
included in MetLife, Inc.’s 2002 Annual Report on Form 10-K.
MetLife, Inc.
F-46