MetLife 2003 Annual Report Download - page 34
Download and view the complete annual report
Please find page 34 of the 2003 MetLife annual report below. You can navigate through the pages in the report by either clicking on the pages listed below, or by using the keyword search tool below to find specific information within the annual report.-
 1
1 -
2
-
3
-
4
-
5
-
6
-
7
-
8
-
9
-
10
-
11
-
12
-
13
-
14
-
15
-
16
-
17
-
18
-
19
-
20
-
21
-
22
-
23
-
 24
24 -
 25
25 -
 26
26 -
 27
27 -
 28
28 -
 29
29 -
 30
30 -
 31
31 -
 32
32 -
 33
33 -
 34
34 -
 35
35 -
 36
36 -
 37
37 -
 38
38 -
 39
39 -
 40
40 -
 41
41 -
 42
42 -
 43
43 -
 44
44 -
45
-
46
-
47
-
48
-
49
-
50
-
51
-
52
-
53
-
54
-
55
-
56
-
57
-
58
-
59
-
60
-
61
-
62
-
63
-
64
-
65
-
66
-
67
-
68
-
69
-
70
-
71
-
72
-
73
-
74
-
75
-
76
-
77
-
78
-
79
-
80
-
81
-
82
-
83
-
84
-
85
-
86
-
87
-
88
-
89
-
90
-
91
-
92
-
93
-
94
-
95
-
96
-
97
 |
 |

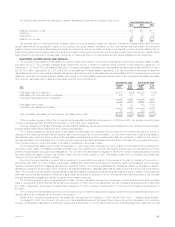
Bonds not due at a single maturity date have been included in the above table in the year of final maturity. Actual maturities may differ from
contractual maturities due to the exercise of prepayment options.
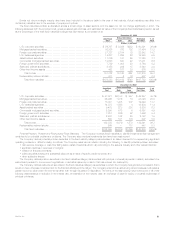
The fixed maturities portfolio is diversified across a broad range of asset sectors, and the asset mix did not change significantly in 2003. The
following tables set forth the amortized cost, gross unrealized gain and loss, and estimated fair value of the Company’s fixed maturities by sector, as well
as the percentage of the total fixed maturities holdings that each sector is comprised of at:
December 31, 2003
Gross Unrealized
Amortized Estimated % of
Cost Gain Loss Fair Value Total
(Dollars in millions)
U.S. corporate securities ************************************************* $ 56,757 $ 3,886 $252 $ 60,391 36.0%
Mortgage-backed securities *********************************************** 30,836 720 102 31,454 18.8
Foreign corporate securities *********************************************** 21,727 2,194 79 23,842 14.2
U.S. treasuries/agencies ************************************************* 14,707 1,264 26 15,945 9.5
Asset-backed securities ************************************************** 11,736 187 60 11,863 7.1
Commercial mortgage-backed securities ************************************ 10,523 530 22 11,031 6.6
Foreign government securities ********************************************* 7,789 1,003 28 8,764 5.2
State and political subdivisions ******************************************** 3,155 209 15 3,349 2.0
Other fixed income assets ************************************************ 492 167 83 576 0.3
Total bonds ******************************************************** 157,722 10,160 667 167,215 99.7
Redeemable preferred stocks ********************************************* 611 2 76 537 0.3
Total fixed maturities ************************************************* $158,333 $10,162 $743 $167,752 100.0%
December 31, 2002
Gross Unrealized
Amortized Estimated % of
Cost Gain Loss Fair Value Total
(Dollars in millions)
U.S. corporate securities************************************************* $ 47,021 $3,193 $ 957 $ 49,257 35.1%
Mortgage-backed securities ********************************************** 26,966 1,076 16 28,026 20.0
Foreign corporate securities ********************************************** 18,001 1,435 207 19,229 13.7
U.S. treasuries/agencies ************************************************* 14,373 1,565 4 15,934 11.4
Asset-backed securities ************************************************* 9,483 228 208 9,503 6.8
Commercial mortgage-backed securities************************************ 6,290 573 6 6,857 4.9
Foreign government securities ******************************************** 7,012 636 52 7,596 5.4
State and political subdivisions ******************************************** 2,580 182 20 2,742 1.9
Other fixed income assets *********************************************** 609 191 103 697 0.5
Total bonds ******************************************************** 132,335 9,079 1,573 139,841 99.7
Redeemable preferred stocks********************************************* 564 — 117 447 0.3
Total fixed maturities************************************************* $132,899 $9,079 $1,690 $140,288 100.0%
Potential Problem, Problem and Restructured Fixed Maturities. The Company monitors fixed maturities to identify investments that management
considers to be potential problems or problems. The Company also monitors investments that have been restructured.
The Company defines potential problem securities in the fixed maturity category as securities of an issuer deemed to be experiencing significant
operating problems or difficult industry conditions. The Company uses various criteria, including the following, to identify potential problem securities:
)debt service coverage or cash flow falling below certain thresholds which vary according to the issuer’s industry and other relevant factors;
)significant declines in revenues or margins;
)violation of financial covenants;
)public securities trading at a substantial discount as a result of specific credit concerns; and
)other subjective factors.
The Company defines problem securities in the fixed maturities category as securities with principal or interest payments in default, securities to be
restructured pursuant to commenced negotiations, or securities issued by a debtor that has entered into bankruptcy.
The Company defines restructured securities in the fixed maturities category as securities to which the Company has granted a concession that it
would not have otherwise considered but for the financial difficulties of the obligor. The Company enters into a restructuring when it believes it will realize a
greater economic value under the new terms rather than through liquidation or disposition. The terms of the restructuring may involve some or all of the
following characteristics: a reduction in the interest rate, an extension of the maturity date, an exchange of debt for equity or a partial forgiveness of
principal or interest.
MetLife, Inc. 31