MetLife 2003 Annual Report Download - page 36
Download and view the complete annual report
Please find page 36 of the 2003 MetLife annual report below. You can navigate through the pages in the report by either clicking on the pages listed below, or by using the keyword search tool below to find specific information within the annual report.-
 1
1 -
2
-
3
-
4
-
5
-
6
-
7
-
8
-
9
-
10
-
11
-
12
-
13
-
14
-
15
-
16
-
17
-
18
-
19
-
20
-
21
-
22
-
23
-
24
-
25
-
 26
26 -
 27
27 -
 28
28 -
 29
29 -
 30
30 -
 31
31 -
 32
32 -
 33
33 -
 34
34 -
 35
35 -
 36
36 -
 37
37 -
 38
38 -
 39
39 -
 40
40 -
 41
41 -
 42
42 -
 43
43 -
 44
44 -
 45
45 -
 46
46 -
47
-
48
-
49
-
50
-
51
-
52
-
53
-
54
-
55
-
56
-
57
-
58
-
59
-
60
-
61
-
62
-
63
-
64
-
65
-
66
-
67
-
68
-
69
-
70
-
71
-
72
-
73
-
74
-
75
-
76
-
77
-
78
-
79
-
80
-
81
-
82
-
83
-
84
-
85
-
86
-
87
-
88
-
89
-
90
-
91
-
92
-
93
-
94
-
95
-
96
-
97
 |
 |

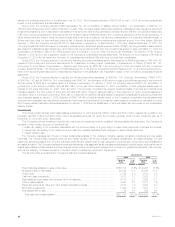
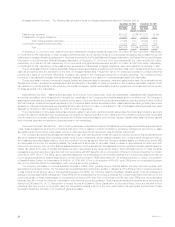
The following table presents the amortized cost, gross unrealized losses and number of securities for fixed maturities where the estimated fair value
had declined and remained below amortized cost by less than 20%, or 20% or more for:
December 31, 2003
Gross Unrealized
Amortized Cost Losses Number of Securities
Less than 20% or Less than 20% or Less than 20% or
20% more 20% more 20% more
(Dollars in millions)
Less than six months********************************************* $24,926 $ 67 $449 $22 1,331 18
Six months or greater but less than nine months ********************** 3,217 19 84 4 264 2
Nine months or greater but less than twelve months ******************* 266 17 7 4 45 3
Twelve months or greater ***************************************** 2,999 113 137 36 311 19
Total ******************************************************* $31,408 $216 $677 $66 1,951 42
The category of fixed maturity securities where the estimated fair value has declined and remained below amortized cost by less than 20% is
comprised of 1,951 securities with an amortized cost of $31,408 million and a gross unrealized loss of $677 million at December 31, 2003. These fixed
maturities mature as follows: 1% due in one year or less; 23% due in greater than one year to five years; 18% due in greater than five years to ten years;
and 58% due in greater than ten years (calculated as a percentage of amortized cost). Additionally, such securities are concentrated by sector in U.S.
corporates (33%) and mortgage-backed (18%); and are concentrated by industry in mortgage-backed (14%), utilities (13%) and finance (7%) (calculated
as a percentage of gross unrealized loss). Non-investment grade securities represent 5% of the $30,731 million fair value and 15% of the $677 million
gross unrealized loss.
The category of fixed maturity securities where the estimated fair value has declined and remained below amortized cost by 20% or more for less
than six months is comprised of 18 securities with an amortized cost of $67 million and a gross unrealized loss of $22 million at December 31, 2003.
These fixed maturities mature as follows: 1% due in greater than one year to five years; 64% due in greater than five years to ten years; and 35% due in
greater than ten years (calculated as a percentage of amortized cost). Additionally, such securities are concentrated by sector in foreign governments
(41%) and asset-backed (35%); and are concentrated by industry in asset-backed (35%) and finance (23%) (calculated as a percentage of gross
unrealized loss). Non-investment grade securities represent 83% of the $45 million fair value and 82% of the $22 million gross unrealized loss.
The total of fixed maturity securities where the estimated fair value has declined and remained below amortized cost by 20% or more for six months
or greater is comprised of 24 securities with an amortized cost of $149 million and a gross unrealized loss of $44 million at December 31, 2003. These
fixed maturities mature as follows: 27% due in greater than five years to ten years; and 73% due in greater than ten years (calculated as a percentage of
amortized cost). Additionally, such securities are concentrated by security type in U.S. corporates (57%) and asset-backed (18%); and are concentrated
by industry in transportation (53%), finance (24%) and asset-backed (18%) (calculated as a percentage of gross unrealized loss). Non-investment grade
securities represent 48% of the $105 million fair value and 60% of the $44 million gross unrealized loss.
The Company held two fixed maturity securities each with a gross unrealized loss at December 31, 2003 greater than $10 million. One of these
securities represents 25% of the gross unrealized loss on fixed maturities where the estimated fair value had declined and remained below amortized cost
by 20% or more for six months or greater. The security is in the U.S. corporate sector, and the estimated fair value and gross unrealized loss at
December 31, 2003 was $14 million and $11 million, respectively. The Company analyzed this fixed maturity security as of December 31, 2003 to
determine whether this security was other-than-temporarily impaired. The Company believes that the estimated fair value of this security, which is in the
transportation industry, was depressed as a result of generally difficult economic and market conditions. The Company believes that the analysis of the
security indicated that the financial strength, liquidity, leverage, future outlook and/or recent management actions supports the view that the security was
not other-than-temporarily impaired as of December 31, 2003.
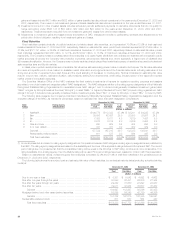
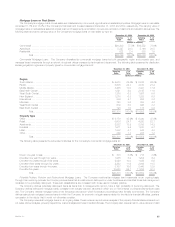
Corporate Fixed Maturities. The table below shows the major industry types that comprise the corporate bond holdings at:
December 31, 2003 December 31, 2002
Estimated % of Estimated % of
Fair Value Total Fair Value Total
(Dollars in millions)
Industrial *************************************************************************** $34,474 40.9% $29,077 42.5%
Utility ****************************************************************************** 9,955 11.8 7,219 10.5
Finance**************************************************************************** 14,287 17.0 12,596 18.4
Yankee/Foreign(1) ******************************************************************* 23,842 28.3 19,229 28.1
Other ***************************************************************************** 1,675 2.0 365 0.5
Total ********************************************************************** $84,233 100.0% $68,486 100.0%
(1) Includes publicly traded, U.S. dollar-denominated debt obligations of foreign obligors, known as Yankee bonds, and other foreign investments.
The Company maintains a diversified corporate bond portfolio across industries and issuers. The portfolio does not have exposure to any single
issuer in excess of 1% of the total invested assets of the portfolio. At December 31, 2003 and 2002, the Company’s combined holdings in the ten
issuers to which it had the greatest exposure totaled $4,683 million and $2,973 million, respectively, which was less than 3% and 2%, respectively, of the
Company’s total invested assets at such date. The exposure to the largest single issuer of corporate bonds held at December 31, 2003 and 2002 was
$618 million and $385 million, respectively.
At December 31, 2003 and 2002, investments of $16,572 million and $14,778 million, respectively, or 69.5% and 76.9%, respectively, of the
Yankee/Foreign sector, represented exposure to traditional Yankee bonds. This exposure was U.S. dollar-denominated and was concentrated by
security type in industrial and financial institutions. The Company diversifies the Yankee/Foreign portfolio by country and issuer.
The Company has hedged all of its material exposure to foreign currency risk in its invested assets. In the Company’s international insurance
operations, both its assets and liabilities are generally denominated in local currencies. Foreign currency denominated securities supporting U.S. dollar
liabilities are generally swapped back into U.S. dollars.
MetLife, Inc. 33