MetLife 2003 Annual Report Download - page 21
Download and view the complete annual report
Please find page 21 of the 2003 MetLife annual report below. You can navigate through the pages in the report by either clicking on the pages listed below, or by using the keyword search tool below to find specific information within the annual report.-
 1
1 -
2
-
3
-
4
-
5
-
6
-
7
-
8
-
9
-
10
-
 11
11 -
 12
12 -
 13
13 -
 14
14 -
 15
15 -
 16
16 -
 17
17 -
 18
18 -
 19
19 -
 20
20 -
 21
21 -
 22
22 -
 23
23 -
 24
24 -
 25
25 -
 26
26 -
 27
27 -
 28
28 -
 29
29 -
 30
30 -
 31
31 -
32
-
33
-
34
-
35
-
36
-
37
-
38
-
39
-
40
-
41
-
42
-
43
-
44
-
45
-
46
-
47
-
48
-
49
-
50
-
51
-
52
-
53
-
54
-
55
-
56
-
57
-
58
-
59
-
60
-
61
-
62
-
63
-
64
-
65
-
66
-
67
-
68
-
69
-
70
-
71
-
72
-
73
-
74
-
75
-
76
-
77
-
78
-
79
-
80
-
81
-
82
-
83
-
84
-
85
-
86
-
87
-
88
-
89
-
90
-
91
-
92
-
93
-
94
-
95
-
96
-
97
 |
 |

be different from the presentation used by other insurance companies and, therefore, amounts in its consolidated statements of income may not be
comparable to amounts reported by other insurers.
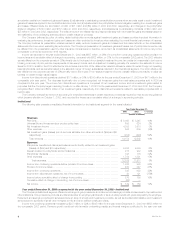
Policyholder benefits and claims decreased by $13 million, or less than 1%, to $5,220 million for the year ended December 31, 2002 from
$5,233 million for the comparable 2001 period. Policyholder benefits and claims for insurance products decreased by $119 million, primarily due to the
impact of the aforementioned reinsurance transaction and the establishment of liabilities for the September 11, 2001 tragedies in the previous year.
Policyholder benefits and claims for annuity and investment-type products increased by $106 million primarily due to an increase in fixed and immediate
annuity liabilities, resulting from business growth and an increase in the liability associated with guaranteed minimum death benefits on variable annuities.
Interest credited to policyholder account balances decreased by $105 million, or 6%, to $1,793 million for the year ended December 31, 2002
compared with $1,898 for the comparable 2001 period. This decrease was primarily due to the establishment of a $118 million policyholder liability with
respect to certain group annuity contracts at New England Financial in 2001. Excluding this policyholder liability, interest credited increased slightly due to
an increase in policyholder account balances which is primarily attributable to sales growth partially offset by declines in interest crediting rates.
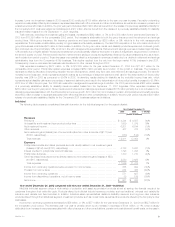
Policyholder dividends increased by $3 million, or less than 1%, to $1,770 million for the year ended December 31, 2002 from $1,767 million for the
comparable 2001 period due to the increase in the invested assets supporting the policies associated with this segment’s large block of traditional life
insurance business. This increase is partially offset by the approval by the Company’s Board of Directors in the fourth quarter of 2002 of a reduction in the
dividend scale to reflect the impact of the current low interest rate environment on the asset portfolios supporting these policies.
Other expenses decreased by $118 million, or 4%, to $2,629 million for the year ended December 31, 2002 million from $2,747 for the comparable
2001 period. Excluding the capitalization and amortization of DAC, which are discussed below, other expenses decreased by $118 million, or 4%, to
$2,922 million in 2002 from $3,040 million in 2001. Other expenses related to insurance products decreased by $129 million, which is attributable to
continued expense management, reductions in volume-related commission expenses in the broker/dealer and other subsidiaries and a reduction of
$62 million related to business realignment expenses incurred in 2001. These decreases are partially offset by increased pension and postretirement
benefit expenses over the comparable period. Other expenses related to annuity and investment-type products increased by $11 million. This increase is
commensurate with the rise in sales of new annuity and investment-type products, as well as increased pension and postretirement benefit expenses.
This increase is partially offset by the reduction of $37 million of business realignment expenses incurred in 2001.
DAC is principally amortized in proportion to gross margins or gross profits, including investment gains or losses. The amortization is allocated to
investment gains and losses to provide consolidated statement of income information regarding the impact of investment gains and losses on the amount
of the amortization, and other expenses to provide amounts related to gross margins or profits originating from transactions other than investment gains
and losses.
Capitalization of DAC increased by $111 million, or 12%, to $1,037 million for the year ended December 31, 2002 from $926 million for the
comparable 2001 period due to higher sales of annuity and investment-type products, resulting in higher commissions and other deferrable expenses.
Total amortization of DAC increased by $100 million, or 15%, to $754 million in 2002 from $654 million in 2001. Amortization of DAC of $744 million and
$633 million is allocated to other expenses in 2002 and 2001, respectively, while the remainder of the amortization in each year is allocated to investment
gains and losses. Increases in amortization of DAC allocated to other expenses of $84 million and $27 million related to insurance products and annuity
and investment-type products, respectively, are due to the impact of the depressed equity markets and changes in the estimates of future gross profits.
In 2002, estimates of future dividend scales, future maintenance expenses, future rider margins, and future reinsurance recoveries were revised. In 2001,
estimates of future fixed account interest spreads, future gross margins and profits related to separate accounts and future mortality margins were
revised.
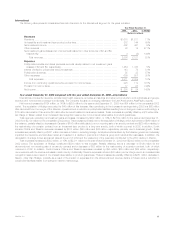
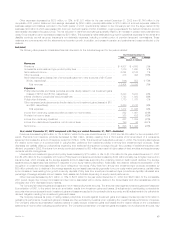
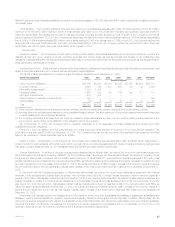
Auto & Home
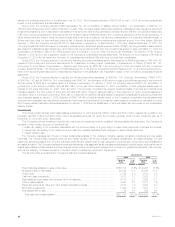
The following table presents consolidated financial information for the Auto & Home segment for the years indicated:
Year Ended December 31,
2002 2001 % Change
(Dollars in millions)
Revenues
Premiums ************************************************************************ $2,828 $2,755 3%
Net investment income ************************************************************* 177 200 (12)%
Other revenues ******************************************************************** 26 22 18%
Net investment gains (losses) ******************************************************** (46) (17) 171%
Total revenues***************************************************************** 2,985 2,960 1%
Expenses
Policyholder benefits and claims****************************************************** 2,019 2,121 (5)%
Other expenses ******************************************************************* 793 800 (1)%
Total expenses **************************************************************** 2,812 2,921 (4)%
Income before provision (benefit) for income taxes*************************************** 173 39 344%
Provision (benefit) for income taxes *************************************************** 41 (2) 2,150%
Net income *********************************************************************** $ 132 $ 41 222%
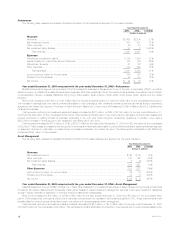
Year ended December 31, 2002 compared with the year ended December 31, 2001—Auto & Home
Premiums increased by $73 million, or 3%, to $2,828 million for the year ended December 31, 2002 from $2,755 million for the comparable 2001
period. Auto and property premiums increased by $66 million and $1 million, respectively, primarily due to increases in average premium earned per
policy resulting from rate increases. The impact on premiums from rate increases was partially offset by an expected reduction in retention and a
reduction in new business sales. Premiums from other personal lines increased by $6 million.
Other revenues increased by $4 million, or 18%, to $26 million for the year ended December 31, 2002 from $22 million for the comparable 2001
period. This increase was primarily due to income earned on a COLI policy purchased in the second quarter of 2002, as well as higher fees on
installment payments. These increases were partially offset by an adjustment to a deferred gain related to the disposition of this segment’s reinsurance
business in 1990.
MetLife, Inc.
18