MetLife 2003 Annual Report Download - page 5
Download and view the complete annual report
Please find page 5 of the 2003 MetLife annual report below. You can navigate through the pages in the report by either clicking on the pages listed below, or by using the keyword search tool below to find specific information within the annual report.-
 1
1 -
 2
2 -
 3
3 -
 4
4 -
 5
5 -
 6
6 -
 7
7 -
 8
8 -
 9
9 -
 10
10 -
 11
11 -
 12
12 -
 13
13 -
 14
14 -
 15
15 -
 16
16 -
17
-
18
-
19
-
20
-
21
-
22
-
23
-
24
-
25
-
26
-
27
-
28
-
29
-
30
-
31
-
32
-
33
-
34
-
35
-
36
-
37
-
38
-
39
-
40
-
41
-
42
-
43
-
44
-
45
-
46
-
47
-
48
-
49
-
50
-
51
-
52
-
53
-
54
-
55
-
56
-
57
-
58
-
59
-
60
-
61
-
62
-
63
-
64
-
65
-
66
-
67
-
68
-
69
-
70
-
71
-
72
-
73
-
74
-
75
-
76
-
77
-
78
-
79
-
80
-
81
-
82
-
83
-
84
-
85
-
86
-
87
-
88
-
89
-
90
-
91
-
92
-
93
-
94
-
95
-
96
-
97
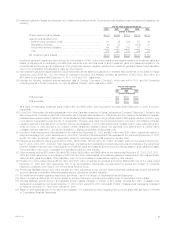
 |
 |

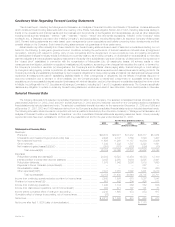
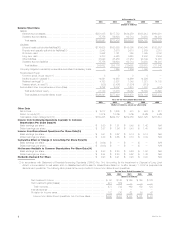
At December 31,
2003 2002 2001 2000 1999
(Dollars in millions)
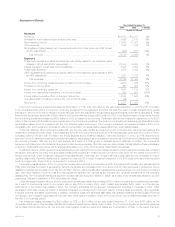
Balance Sheet Data
Assets:
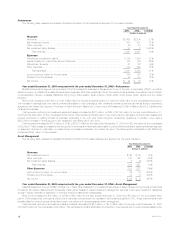
General account assets****************************************** $251,085 $217,733 $194,256 $183,912 $160,291
Separate account assets***************************************** 75,756 59,693 62,714 70,250 64,941
Total assets ************************************************** $326,841 $277,426 $256,970 $254,162 $225,232
Liabilities:
Life and health policyholder liabilities(10) **************************** $176,628 $162,569 $148,395 $140,040 $122,637
Property and casualty policyholder liabilities(10) ********************** 2,943 2,673 2,610 2,559 2,318
Short-term debt ************************************************ 3,642 1,161 355 1,085 4,180
Long-term debt************************************************* 5,703 4,425 3,628 2,400 2,494
Other liabilities ************************************************** 41,020 28,255 21,950 20,349 14,972
Separate account liabilities *************************************** 75,756 59,693 62,714 70,250 64,941
Total liabilities************************************************* 305,692 258,776 239,652 236,683 211,542
Company-obligated mandatorily redeemable securities of subsidiary trusts** — 1,265 1,256 1,090 —
Stockholders’ Equity:
Common stock, at par value(11) ********************************** 8888—
Additional paid-in capital(11) ************************************** 14,991 14,968 14,966 14,926 —
Retained earnings(11)******************************************** 4,193 2,807 1,349 1,021 14,100
Treasury stock, at cost(11) *************************************** (835) (2,405) (1,934) (613) —
Accumulated other comprehensive income (loss)*********************** 2,792 2,007 1,673 1,047 (410)
Total stockholders’ equity*************************************** 21,149 17,385 16,062 16,389 13,690
Total liabilities and stockholders’ equity *************************** $326,841 $277,426 $256,970 $254,162 $225,232
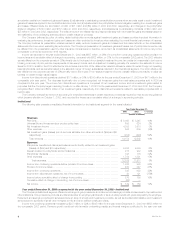
At or for the Years Ended December 31,
2003 2002 2001 2000 1999
(Dollars in millions, except per share data)
Other Data
Net income ****************************************************** $ 2,217 $ 1,605 $ 473 $ 953 $ 617
Return on equity(12)*********************************************** 13.1% 10.8% 3.2% 6.5% 4.5%
Total assets under management(13)********************************** $350,235 $299,187 $282,486 $301,325 $373,612
Income from Continuing Operations Available to Common
Shareholders Per Share Data(14)
Basic earnings per share ******************************************* $ 2.60 $ 1.61 $ 0.49 $ 1.42 N/A
Diluted earnings per share****************************************** $ 2.57 $ 1.56 $ 0.48 $ 1.40 N/A
Income from Discontinued Operations Per Share Data(14)
Basic earnings per share ******************************************* $ 0.41 $ 0.67 $ 0.14 $ 0.10 N/A
Diluted earnings per share****************************************** $ 0.40 $ 0.65 $ 0.14 $ 0.09 N/A
Cumulative Effect of Change in Accounting Per Share Data(14)
Basic earnings per share ******************************************* $ (0.04) $ — $ — $ — N/A
Diluted earnings per share****************************************** $ (0.03) $ — $ — $ — N/A
Net Income Available to Common Shareholders Per Share Data(14)
Basic earnings per share ******************************************* $ 2.98 $ 2.28 $ 0.64 $ 1.52 N/A
Diluted earnings per share****************************************** $ 2.94 $ 2.20 $ 0.62 $ 1.49 N/A
Dividends Declared Per Share ************************************* $ 0.23 $ 0.21 $ 0.20 $ 0.20 N/A
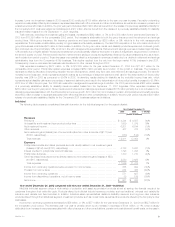
(1) In accordance with Statement of Financial Accounting Standards (‘‘SFAS’’) No. 144, Accounting for the Impairment or Disposal of Long-Lived
Assets, income related to real estate sold or classified as held-for-sale for transactions initiated on or after January 1, 2002 is presented as
discontinued operations. The following table presents the components of income from discontinued operations:
For the Years Ended December 31,
2003 2002 2001 2000 1999
(Dollars in millions)
Net investment income ******************************************* $ 52 $ 160 $ 169 $ 159 $ 128
Net investment gains (losses) ************************************** 421 582 — — —
Total revenues ************************************************* 473 742 169 159 128
Interest expense ************************************************* 1 1———
Provision for income taxes***************************************** 172 270 62 58 47
Income from discontinued operations, net of income taxes************ $ 300 $ 471 $ 107 $ 101 $ 81
MetLife, Inc.
2