MetLife 2003 Annual Report Download - page 70
Download and view the complete annual report
Please find page 70 of the 2003 MetLife annual report below. You can navigate through the pages in the report by either clicking on the pages listed below, or by using the keyword search tool below to find specific information within the annual report.-
 1
1 -
2
-
3
-
4
-
5
-
6
-
7
-
8
-
9
-
10
-
11
-
12
-
13
-
14
-
15
-
16
-
17
-
18
-
19
-
20
-
21
-
22
-
23
-
24
-
25
-
26
-
27
-
28
-
29
-
30
-
31
-
32
-
33
-
34
-
35
-
36
-
37
-
38
-
39
-
40
-
41
-
42
-
43
-
44
-
45
-
46
-
47
-
48
-
49
-
50
-
51
-
52
-
53
-
54
-
55
-
56
-
57
-
58
-
59
-
 60
60 -
 61
61 -
 62
62 -
 63
63 -
 64
64 -
 65
65 -
 66
66 -
 67
67 -
 68
68 -
 69
69 -
 70
70 -
 71
71 -
 72
72 -
 73
73 -
 74
74 -
 75
75 -
 76
76 -
 77
77 -
 78
78 -
 79
79 -
 80
80 -
81
-
82
-
83
-
84
-
85
-
86
-
87
-
88
-
89
-
90
-
91
-
92
-
93
-
94
-
95
-
96
-
97
 |
 |

METLIFE, INC.
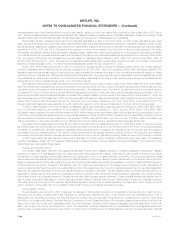
NOTES TO CONSOLIDATED FINANCIAL STATEMENTS — (Continued)
discontinued fair value hedges during the years ended December 31, 2003 or 2002. There were no derivatives designated as fair value hedges during
the year ended December 31, 2001.
For the years ended December 31, 2003 and 2002, the net amounts accumulated in other comprehensive income relating to cash flow hedges
were losses of $417 million and $24 million, respectively. For the years ended December 31, 2003 and 2002, the market value of cash flow hedges
decreased by $456 million and $145 million, respectively. During the years ended December 31, 2003 and 2002, the Company recognized other
comprehensive net losses of $387 million and $142 million, respectively, relating to the effective portion of cash flow hedges. During the year ended
December 31, 2003, other comprehensive expense of $2 million was reclassified to net investment income. During the year ended December 31, 2002
other comprehensive losses of $57 million were reclassified to net investment losses. During the year ended December 31, 2003, insignificant amounts
were recognized in net investment losses related to discontinued cash flow hedges. During the years ended December 31, 2002 and 2001, no cash
flow hedges were discontinued. For the years ended December 31, 2003, 2002 and 2001, $8 million, $10 million and $19 million of other
comprehensive income was reclassified to net investment income, respectively, related to the SFAS 133 transition adjustment.
Approximately $2 million of net investment expense and $40 million of net losses reported in accumulated other comprehensive income at
December 31, 2003 are expected to be reclassified during the year ending December 31, 2004 into net investment income and net investment loss,
respectively, as the derivatives and underlying investments mature or expire according to their original terms.
For the years ended December 31, 2003, 2002 and 2001, the Company recognized as net investment gains, the scheduled periodic settlement
payments on derivative instruments of $84 million, $32 million and $24 million, respectively, and net investment losses from changes in fair value of
$218 million and $172 million and net investment gains of $100 million, respectively, related to derivatives not qualifying as accounting hedges.
The Company uses forward exchange contracts that provide an economic hedge on portions of its net investments in foreign operations against
adverse movements in foreign currency exchange rates. For the year ended December 31, 2003, the Company experienced net unrealized foreign
currency losses of $10 million related to hedges of its net investments in foreign operations. These unrealized losses were recorded as components of
accumulated other comprehensive income.
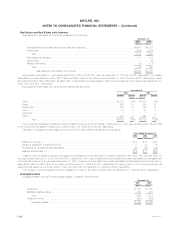
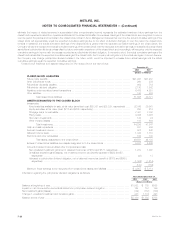
4. Insurance
Deferred Policy Acquisition Costs
Information regarding VOBA and DAC for the years ended December 31, 2003, 2002 and 2001 is as follows:
Deferred
Value of Policy
Business Acquisition
Acquired Costs Total
(Dollars in millions)
Balance at December 31, 2000 *********************************************************** $1,674 $ 8,944 $10,618
Capitalizations ************************************************************************** — 2,039 2,039
Acquisitions **************************************************************************** 124 — 124
Total ****************************************************************************** 1,798 10,983 12,781
Amortization allocated to:
Net investment gains (losses) *********************************************************** (15) 40 25
Unrealized investment gains (losses)****************************************************** 8 132 140
Other expenses *********************************************************************** 126 1,287 1,413
Total amortization ******************************************************************** 119 1,459 1,578
Dispositions and other ******************************************************************* (1) (35) (36)
Balance at December 31, 2001 *********************************************************** 1,678 9,489 11,167
Capitalizations ************************************************************************** 2,340 2,340
Acquisitions **************************************************************************** 369 — 369
Total ****************************************************************************** 2,047 11,829 13,876
Amortization allocated to:
Net investment gains (losses) *********************************************************** 16 (11) 5
Unrealized investment gains (losses)****************************************************** 154 384 538
Other expenses *********************************************************************** 132 1,507 1,639
Total amortization ******************************************************************** 302 1,880 2,182
Dispositions and other ******************************************************************* (6) 39 33
Balance at December 31, 2002 *********************************************************** 1,739 9,988 11,727
Capitalizations ************************************************************************** — 2,792 2,792
Acquisitions **************************************************************************** 40 218 258
Total ****************************************************************************** 1,779 12,998 14,777
MetLife, Inc. F-25