MetLife 2003 Annual Report Download - page 62
Download and view the complete annual report
Please find page 62 of the 2003 MetLife annual report below. You can navigate through the pages in the report by either clicking on the pages listed below, or by using the keyword search tool below to find specific information within the annual report.-
 1
1 -
2
-
3
-
4
-
5
-
6
-
7
-
8
-
9
-
10
-
11
-
12
-
13
-
14
-
15
-
16
-
17
-
18
-
19
-
20
-
21
-
22
-
23
-
24
-
25
-
26
-
27
-
28
-
29
-
30
-
31
-
32
-
33
-
34
-
35
-
36
-
37
-
38
-
39
-
40
-
41
-
42
-
43
-
44
-
45
-
46
-
47
-
48
-
49
-
50
-
51
-
 52
52 -
 53
53 -
 54
54 -
 55
55 -
 56
56 -
 57
57 -
 58
58 -
 59
59 -
 60
60 -
 61
61 -
 62
62 -
 63
63 -
 64
64 -
 65
65 -
 66
66 -
 67
67 -
 68
68 -
 69
69 -
 70
70 -
 71
71 -
 72
72 -
73
-
74
-
75
-
76
-
77
-
78
-
79
-
80
-
81
-
82
-
83
-
84
-
85
-
86
-
87
-
88
-
89
-
90
-
91
-
92
-
93
-
94
-
95
-
96
-
97
 |
 |

METLIFE, INC.
NOTES TO CONSOLIDATED FINANCIAL STATEMENTS — (Continued)
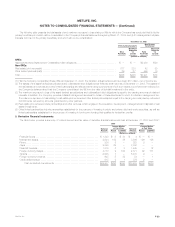
2. Investments
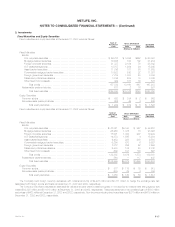
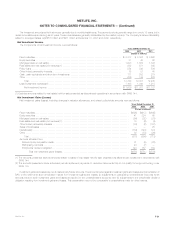
Fixed Maturities and Equity Securities
Fixed maturities and equity securities at December 31, 2003 were as follows:
Cost or Gross Unrealized
Amortized Estimated
Cost Gain Loss Fair Value
(Dollars in millions)
Fixed Maturities:
Bonds:
U.S. corporate securities ************************************************** $ 56,757 $ 3,886 $252 $ 60,391
Mortgage-backed securities ************************************************ 30,836 720 102 31,454
Foreign corporate securities ************************************************ 21,727 2,194 79 23,842
U.S treasuries/agencies *************************************************** 14,707 1,264 26 15,945
Asset-backed securities *************************************************** 11,736 187 60 11,863
Commercial mortgage-backed securities ************************************* 10,523 530 22 11,031
Foreign government securities ********************************************** 7,789 1,003 28 8,764
States and political subdivisions ******************************************** 3,155 209 15 3,349
Other fixed income assets ************************************************* 492 167 83 576
Total bonds ********************************************************* 157,722 10,160 667 167,215
Redeemable preferred stocks ************************************************ 611 2 76 537
Total fixed maturities ************************************************** $158,333 $10,162 $743 $167,752
Equity Securities:
Common stocks *********************************************************** $ 620 $ 334 $ 2 $ 952
Nonredeemable preferred stocks ********************************************* 602 48 4 646
Total equity securities ************************************************* $ 1,222 $ 382 $ 6 $ 1,598
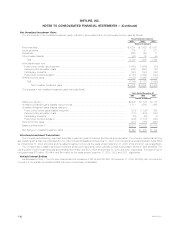
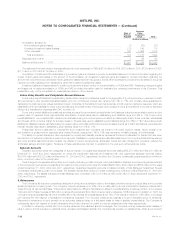
Fixed maturities and equity securities at December 31, 2002 were as follows:
Cost or Gross Unrealized
Amortized Estimated
Cost Gain Loss Fair Value
(Dollars in millions)
Fixed Maturities:
Bonds:
U.S. corporate securities************************************************** $ 47,021 $3,193 $ 957 $ 49,257
Mortgage-backed securities *********************************************** 26,966 1,076 16 28,026
Foreign corporate securities *********************************************** 18,001 1,435 207 19,229
U.S treasuries/agencies ************************************************** 14,373 1,565 4 15,934
Asset-backed securities ************************************************** 9,483 228 208 9,503
Commercial mortgage-backed securities************************************* 6,290 573 6 6,857
Foreign government securities ********************************************* 7,012 636 52 7,596
States and political subdivisions ******************************************** 2,580 182 20 2,742
Other fixed income assets ************************************************ 609 191 103 697
Total bonds ********************************************************* 132,335 9,079 1,573 139,841
Redeemable preferred stocks************************************************ 564 — 117 447
Total fixed maturities************************************************** $132,899 $9,079 $1,690 $140,288
Equity Securities:
Common stocks*********************************************************** $ 877 $ 115 $ 79 $ 913
Nonredeemable preferred stocks ********************************************* 679 25 4 700
Total equity securities************************************************* $ 1,556 $ 140 $ 83 $ 1,613
The Company held foreign currency derivatives with notional amounts of $4,273 million and $2,371 million to hedge the exchange rate risk
associated with foreign bonds and loans at December 31, 2003 and 2002, respectively.
The Company held fixed maturities at estimated fair values that were below investment grade or not rated by an independent rating agency that
totaled $12,825 million and $11,619 million at December 31, 2003 and 2002, respectively. These securities had a net unrealized gain of $888 million
and a loss of $422 million at December 31, 2003 and 2002, respectively. Non-income producing fixed maturities were $371 million and $479 million at
December 31, 2003 and 2002, respectively.
MetLife, Inc. F-17